Simple Asset Class ETF Value Strategy (SACEVS)
A systematic approach that allocates across asset classes based on relative valuations, seeking undervalued opportunities.
Value Allocations for August 2026 (Final)
The asset with the highest allocation is the holding of the Best Value strategy.
Unlock Current Allocations
Get instant access to current value allocations, historical performance data, and monthly signal updates.
How It Works
The Concept
Value investing seeks undervalued assets. When an asset class trades below its historical norm, it may offer better future returns.
The Universe
We analyze 4 asset classes: Cash, long-term Treasuries (TLT), investment-grade bonds (LQD), and U.S. stocks (SPY).
The Signal
Monthly allocations are based on relative valuations. Higher allocations go to assets that appear more undervalued.
Implementation
Adjust holdings based on the percentage allocations. The highest allocation asset is the "Best Value" holding.
Key Details
- Value strategies complement momentum by targeting different market inefficiencies
- Allocations range from 0-100% based on relative valuations
- The highest allocation asset is the "Best Value" holding
- Simple implementation with just 4 broadly diversified ETFs
- Monthly rebalancing captures value opportunities as they emerge
Strategy Details
Government securities, corporate bonds and equities arguably compete for investments at increasing levels of inherent risk based on: (1) valuations relative to each other, measured by risk premiums; and, (2) attractiveness of these risk premiums relative to their respective historical norms.
The Simple Asset Class ETF Value Strategy (SACEVS) seeks diversification across a small set of U.S. Treasury note, corporate bond and stock ETFs [iShares 20+ Year Treasury Bond (TLT), iShares iBoxx $ Investment Grade Corporate Bond (LQD) and SPDR S&P 500 (SPY)], plus a monthly tactical edge from timing the following three risk premiums associated with these asset classes:
- Term – monthly difference between the 10-year Constant Maturity U.S. Treasury note (T-note) yield and the 3-month Constant Maturity U.S. Treasury bill (T-bill) yield.
- Credit – monthly difference between the Moody’s Seasoned Baa Corporate Bonds yield and the T-note yield.
- Equity – monthly difference between S&P 500 operating earnings yield and the T-note yield (see also “Methodology Changes”).
There are two versions of SACEVS: (1) Best Value, which at the end of each month picks the most undervalued premium (if any); and, (2) Weighted, which at the end of each month weights all undervalued premiums (if any) according to degree of undervaluation. Based on the assets considered, the principal benchmark is a monthly rebalanced portfolio of 60% SPY-40% TLT (60-40).
Supporting research includes (items may at times be unavailable for a few days during updates):
- “Make SACEVS More Adaptive?” examines use of a rolling, rather than an inception-to-date , lookback window for SACEVS calibration.
- “U.S. Federal Taxes and SACEVS, SACEMS” explores the effects of federal taxes (in taxable accounts) on SACEVS performance.
- “Forcing SACEMS to Agree with SACEVS” tests effects on Simple Asset Class ETF Momentum Strategy (SACEMS) performance of forcing SACEMS to agree with SACEVS when the latter assigns zero weight to stocks or government bonds.
- “SACEVS with Quarterly Allocation Updates” tests the effects on performance of quarterly rather than monthly portfolio reformation.
- “SACEVS with SMA Filter” examines whether applying a simple moving average (SMA) filter to SACEVS selections improves strategy performance.
- “SACEVS Applied to Mutual Funds” extends testing backward in time by using mutual funds rather than ETFs to capture undervalued premiums.
- “SACEVS and SACEMS from a European Perspective” investigates the effects of the U.S. dollar-euro exchange rate on strategy performances, addressing the perspective of a European investor.
- “Add REITs to SACEVS?” tests the addition of a real estate risk premium, derived from the yield on equity Real Estate Investment Trusts (REIT). “Add Utilities to SACEVS?” tests the addition of a utilities premium, derived from the yield on Utilities Select Sector SPDR Fund (XLU).
- “Substitute VIG for SPY in SACEVS and SACEMS?” tests a single specific asset substitution in SACEVS. “Conditionally Substitute SSO for SPY in SACEVS and SACEMS?” test a single specific leveraged asset substitution in SACEVS. “Substitute QQQ for SPY in SACEVS and SACEMS?” tests effects of using a different, thematic index for large capitalization stocks. “Horse Race: SSO or QQQ vice SPY in SACEVS and SACEMS?” extends that test to a comparison of thematic and leveraged stocks.
- “Effects of Execution Delay on SACEVS” looks at effects of delaying action on changes in SACEVS portfolio weights for up to 21 trading days.
- “SACEVS Performance When Interest Rates Rise” examines effects of interest rates changes on the strategy.
- “SACEVS Performance When Stocks Rise and Fall” investigates how the strategy performs when the U.S. stock market rises and falls.
- “SACEVS Input Risk Premiums and EFFR” tests how the strategy might react to increases in the Federal Funds Rate.
- “SACEVS with Margin” and “SACEVS-SACEMS Leverage Sensitivity Tests” explore use of margin rebalanced monthly to boost SACEVS performance.
- “SACEMS and SACEVS Changes for Coordination and Liquidity” documents minor April 2017 adjustments that trade purity of logic for practicality.
We started tracking SACEVS in 2015, with only slight adjustments since as documented in the above list.
Some investors may want to follow one of the two strategy alternatives tracked here. Others may want to adapt them with modifications suited to their individual goals and constraints. Still others may want to apply the analysis approaches to test other strategies. Something to keep in mind is that adding complexity to the strategy with refining variables/parameters increases the number of ways to optimize and thereby elevates potential for data snooping bias.
The next section summarizes historical (backtest) performance data.
Historical Performance
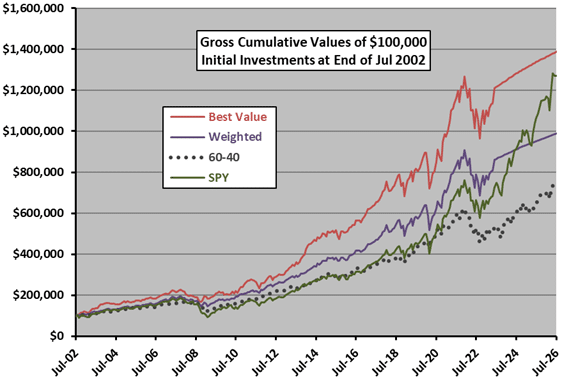
The following chart shows the gross cumulative values of $100,000 initial investments in the Best Value and Weighted portfolios since the end of July 2002 (when all ETFs considered are first available). The chart includes the 60-40 portfolio as a benchmark and buying and holding SPY for reference.
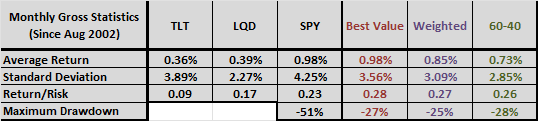
The following table summarizes some monthly statistics for these same strategies and their ETF components over the available sample period. Return/Risk is average return divided by standard deviation. Maximum (peak-to-trough) drawdowns are based on monthly measurements over the available sample period.
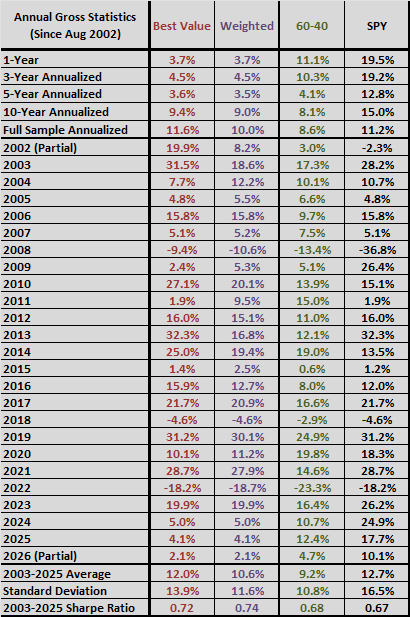
The next table summarizes annual/annualized returns for these strategies over different intervals commonly used to describe performance of funds. The annualized returns are compound annual growth rates (CAGR). For Sharpe ratio, to calculate excess annual return, we use average monthly yield on 3-month Treasury bills during a year as the risk-free rate for that year.
The next section offers a discussion of this performance.
Value Allocations for August 2026 (Final)
Performance Assessment
The charts and data below show how the value strategy has performed over time compared to passive benchmarks. Results are based on backtested data and actual signals since inception.
Subscriber Content
Subscribe to view detailed performance data, charts, and historical returns.
Get Full AccessBacktest It Yourself
Use the Growth Simulator to compare strategy variants over any time period, or blend value with momentum to find your ideal mix.
Open Strategy Tools