
Are readily available crowdsourced firm earnings estimates and stock sentiment measurements exploitable? In the September 2015 revision of their paper entitled “Tweet Sentiments and Crowd-Sourced Earnings Estimates as Valuable Sources of Information Around Earnings Releases”, Jim Kyung-Soo Liew, Shenghan Guo and Tongli Zhang investigate whether earnings estimates from Estimize and sentiment measurements from iSentium usefully predict stock behavior after earnings announcements. Estimize aggregates inputs from students, independent researchers, private investors, sell-side professionals and buy-side analysts to generate earnings estimates. iSentium derives sentiment scores (ranging from -30 to +30) from real-time natural language processing of Twitter texts about stocks, market indexes and exchange-traded funds. The authors relate pre-announcement earnings estimates and sentiment to post-earnings announcement stock returns. Using Estimize and iSentium data as available, Wall Street consensus earnings estimates, actual firm quarterly earnings and associated stock returns for 16,840 earnings announcements during November 2011 through December 2014, they find that:
- Estimize earnings estimates are somewhat more accurate than Wall Street consensus earnings. Estimize (Wall Street consensus) estimates are lower than actual earnings 52%-54% (65%-68%) of the time.
- iSentium tweet sentiment measurements offer economically and statistically significant information not contained in such variables as earnings surprise, analyst coverage, analyst track record and earnings volatility.
- Combining pre-announcement iSentium tweet sentiments with Estimize-based earnings surprises identifies stocks that are likely to do especially well (negative sentiment and positive earnings surprise) and especially poorly (negative sentiment and negative earnings surprise) during the days after earnings announcements. (See the chart below.)
The following chart, taken from the paper, compares average gross cumulative three-factor (market, size, book-to-market) alphas during the 20 trading days after earnings announcement for four sets of stocks sorted based on pre-announcement Estimize earnings estimate and iSentium tweet sentiment:
- Positive sentiment and positive earnings surprise.
- Positive sentiment and negative earnings surprise.
- Negative sentiment and positive earnings surprise.
- Negative sentiment and negative earnings surprise.
Day 0 is the earnings announcement date. Group 3 has the largest terminal gain (0.87%) and the strongest performance at all intra-month horizons. Group 4 has the weakest performance at all intra-month horizons and is particularly weak three to five trading days after the announcement date.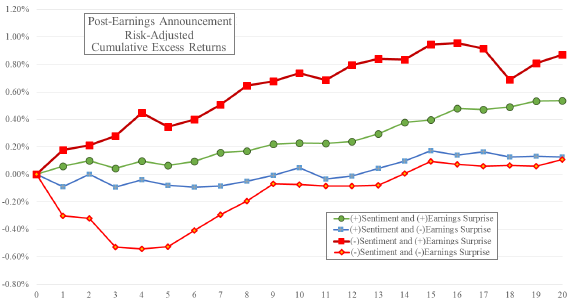
In summary, evidence suggests that crowdsourced earnings estimates and tweet sentiment predict gross post-earnings announcement stock performance.
Cautions regarding findings include:
- As noted in the paper, performance statistics are gross, not net. Accounting for trading frictions, shorting costs and costs of information/processing would reduce these returns.
- Testing multiple strategies on the same sample introduces data snooping bias, such that the best (worst) strategy tends to overstate (understate) expectations.
- Since earnings announcements tend to cluster, trading opportunities are likely also to cluster, such that: (1) capital constraints may at times limit exploitability; and, (2) there may be extended intervals of no opportunities.
- The sample period is very short in terms of variety of economic/market conditions.
- More extreme thresholds for earnings surprises and sentiment may produce stronger results.
Frequently Asked Questions
What are crowdsourced earnings estimates and Twitter stock sentiment scores?
Crowdsourced earnings estimates, such as those from Estimize, aggregate forecasts from students, independent researchers, private investors, sell-side professionals and buy-side analysts. Twitter stock sentiment scores, such as those from iSentium, are derived from real-time natural language processing of tweets about stocks, indexes and ETFs, and range from -30 to +30.
Do Twitter sentiment and crowdsourced earnings estimates predict stock returns after earnings announcements?
Twitter sentiment combined with crowdsourced earnings estimates predicts gross post-earnings announcement stock returns. Stocks with negative pre-announcement iSentium sentiment and a positive Estimize-based earnings surprise earned the largest 20-trading-day three-factor alpha of 0.87%, while negative sentiment with a negative surprise performed worst. The sample covered 16,840 earnings announcements from November 2011 to December 2014, and returns are gross.
How is the combined sentiment and earnings surprise strategy tested around earnings announcements?
The authors sorted stocks into four groups based on pre-announcement iSentium tweet sentiment (positive or negative) and Estimize-based earnings surprise (positive or negative). They then compared average gross cumulative three-factor (market, size, book-to-market) alphas over the 20 trading days after each earnings announcement. The test used 16,840 announcements from November 2011 through December 2014, with Day 0 as the announcement date.
Are crowdsourced earnings estimates more accurate than Wall Street consensus estimates?
Estimize crowdsourced earnings estimates are somewhat more accurate than Wall Street consensus estimates. Estimize estimates fall below actual earnings 52%-54% of the time, versus 65%-68% for Wall Street consensus, indicating less downward bias. Tweet sentiment also adds economically and statistically significant information beyond earnings surprise, analyst coverage, analyst track record and earnings volatility.
What are the limitations of trading on Twitter sentiment and crowdsourced earnings estimates?
The reported returns are gross, so trading frictions, shorting costs and information/processing costs would reduce them. Testing multiple strategies on the same sample introduces data snooping bias, and the 2011-2014 sample is short in terms of economic and market conditions. Clustering of earnings announcements may also limit exploitability through capital constraints and extended periods with no opportunities.