
Is there a common optimal set of ranking (lookback) interval, holding interval, weighting scheme and skip-month rule for long-short stock momentum strategies across European country markets? In her May 2019 paper entitled “Are Momentum Strategies Profitable? Recent Evidence from European Markets”, Anastasia Slabchenko identifies optimal parameter sets from 576 long-short stock momentum strategy variations in each of France, Germany, Greece, Italy, Netherlands, Portugal, Spain, Sweden and UK. Variations derive from:
- Past return ranking (lookback) intervals of 1 to 12 months.
- Holding intervals of 1 to 12 months.
- Value weighted (VW) or equal-weighted (EW) momentum portfolios.
- Skip-month or no skip-month between ranking and holding intervals.
She defines the optimal variation as that generating the highest average gross monthly return. Using end-of-month closing prices for stock samples from each country, excluding financial stocks and stocks priced less than one euro, during December 1989 through January 2018, she finds that:
- Optimal momentum strategy parameter sets differ from country to country (see the chart below).
- Average gross monthly returns by country for optimal parameter sets range from 0.75% (Greece) to 1.69% (Sweden).
The following table, constructed from data in the paper, summarizes optimal long-short stock momentum strategy parameter sets by country based on highest average gross monthly return. Optimal ranking intervals vary considerably. Optimal holding intervals are mostly short. Optimal weighting is mostly VW. No skip-month is mostly preferable.
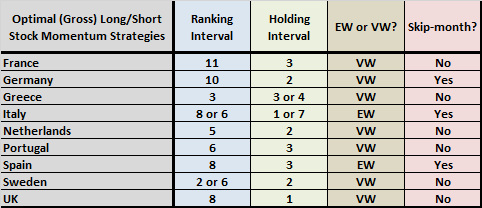
In summary, evidence from European country markets indicates that optimal parameter sets for long-short stock momentum strategies, based on average gross monthly return, vary by market.
Cautions regarding findings include:
- Reported momentum portfolio performance data are gross, not net. Costs of portfolio reformation and shorting would reduce all returns, and shorting may not always be feasible as specified. Moreover:
- Shorter ranking and holding intervals have higher turnover and trading frictions than longer ones, such that net findings may differ from gross findings.
- EW momentum portfolios hold larger positions in small stocks than VW portfolios. Since small stocks are typically less liquid and have higher trading frictions than large stocks, net findings may differ from gross findings.
- Highest average gross monthly return may not translate to highest gross cumulative return or highest Sharpe ratio over the sample period.
- Testing so many strategy variations on the same samples introduces extreme data snooping bias, such that optimal performances substantially overstate expectations.
- There is no fundamental reason to exclude financial stocks from momentum studies. Including financial stocks may affect findings.
For comparison, see “Optimal Intrinsic Momentum and SMA Intervals Across Asset Classes”.
Frequently Asked Questions
What is a long-short stock momentum strategy?
A long-short stock momentum strategy buys stocks with the strongest past returns and shorts those with the weakest, based on a ranking (lookback) interval. In the European study, it is defined by four parameters: ranking interval (1 to 12 months), holding interval (1 to 12 months), value or equal weighting, and whether a skip-month separates ranking from holding.
Is there one optimal set of parameters for stock momentum strategies across European markets?
No, optimal long-short stock momentum parameter sets differ from country to country across nine European markets (December 1989 to January 2018). Optimal average gross monthly returns ranged from 0.75% in Greece to 1.69% in Sweden. Optimal holding intervals were mostly short, weighting was mostly value-weighted, and no skip-month was mostly preferable, while optimal ranking intervals varied considerably.
How are optimal momentum strategy parameters identified and tested across countries?
Optimal momentum parameters were identified by testing 576 long-short strategy variations in each of nine European countries (France, Germany, Greece, Italy, Netherlands, Portugal, Spain, Sweden and UK). Variations combined 1 to 12 month ranking intervals, 1 to 12 month holding intervals, value or equal weighting, and skip-month or no skip-month. The optimal variation is the one with the highest average gross monthly return, using end-of-month closing prices from December 1989 to January 2018 and excluding financial stocks and stocks priced under one euro.
How do value-weighted and equal-weighted momentum portfolios differ in practice?
Equal-weighted momentum portfolios hold larger positions in small stocks than value-weighted portfolios, whereas value-weighted portfolios were mostly optimal in the European study. Small stocks are typically less liquid and carry higher trading frictions than large stocks. Net results for equal-weighted portfolios may therefore differ from the reported gross results.
What are the limitations of optimized momentum strategy backtests like this one?
The reported momentum returns are gross, so costs of portfolio reformation and shorting would reduce them, and shorting may not always be feasible. Short ranking and holding intervals have higher turnover and trading frictions, and the highest average monthly return may not give the highest cumulative return or Sharpe ratio. Testing 576 variations on the same samples creates extreme data snooping bias, so optimal performance substantially overstates expectations, and excluding financial stocks may also affect findings.