
Several recent papers find that most studies identifying factors that predict stock returns are not replicable or derive from snooping of many factors. Is there a good counter-argument? In their January 2021 paper entitled “Is There a Replication Crisis in Finance?”, Theis Ingerslev Jensen, Bryan Kelly and Lasse Pedersen apply a Bayesian model of factor replication to a set of 153 factors applied to stocks across 93 countries. For each factor in each country, they each month:
- Sort stocks into thirds (top/middle/bottom) with breakpoints based on non-micro stocks in that country.
- For each third, compute a “capped value weight” gross return (winsorizing market equity at the NYSE 80th percentile to ensure that tiny stocks have tiny weights no mega-stock dominates).
- Calculate the gross return for a hedge portfolio that is long (short) the third with the highest (lowest) expected return.
- Calculate the corresponding 1-factor gross alpha via simple regression versus the country portfolio.
They further propose a taxonomy that systematically assigns each of the 153 factors to one of 13 themes based on high within-theme return correlations and conceptual similarities. Using firm and stock data required to calculate the specified factors starting 1926 for U.S. stocks and 1986 for most developed countries (in U.S. dollars), and 1-month U.S. Treasury bill yields to compute excess returns, all through 2019, they find that:
- Based on the specified approach, a large majority of the 153 factors replicate, survive joint testing of all factors, hold up out-of-sample and are strengthened by global evidence (see the chart below).
- A non-trivial (but not disastrous) minority of factors fail to replicate.
- Weakening of factor alphas post-publication is an expected outcome of Bayesian learning, not proof of data snooping. Results confirm the Bayesian prediction that higher pre-publication alphas should translate to higher post-publication alphas.
- 10 of the 13 factor themes replicate, the exceptions relating to size, seasonality and leverage factors.
- World factor gross alphas are economically meaningful, often over 0.3% per month.
The following chart, taken from the paper, summarizes progression of equity factor replicability rate starting from a baseline of 35% replication rate for 452 previously published factors as presented in a recent influential paper to:
- 56.9% after: extending sample periods (+4.3%); focusing strictly on a 1-month portfolio holding interval (+4.0%); using capped value weights in factor portfolios as specified above (+8.5%); adding 15 factors to the baseline set (+2.4%); and, making minor changes to factor definitions (+2.7%).
- 64.7% after then excluding a number of factors found to be insignificant in original studies.
- 84.9% after then using 1-factor-gross alphas rather than gross raw returns to assess statistical significance.
- 77.3% after then applying a leading conventional method to account for multiple testing, thereby raising the threshold for statistical significance.
- 84.0% after then substituting for the conventional multiple testing correction a Bayesian model that directly tests joint behavior of all factors.
- 84.9% after then expanding the dataset to encompass 93 countries.
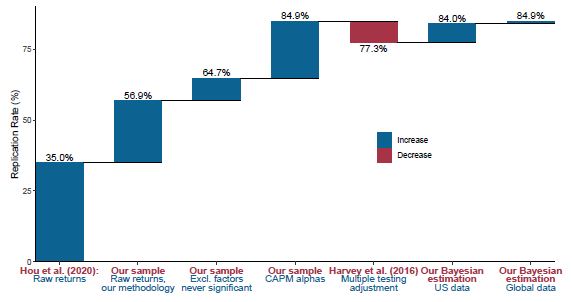
In summary, evidence indicates that most of the body of equity factor research is valid.
Cautions regarding findings include:
- It is not obvious that de-emphasizing roles of the largest stocks in factor return calculations is representative of investor experiences in the market.
- Findings are gross, not net.
- Accounting for data costs, monthly factor portfolio reformation frictions and shorting costs would reduce all returns. Shorting may not always be feasible as specified. Costs are likely material compared to gross alphas found in the study.
- Both the exclusion of factors with holding periods longer than one month and the factor portfolio weighting scheme makes reformation frictions in this study higher on average than those in the baseline study.
- Applying findings are beyond the reach of most investors, who would bear fees for delegating to a fund manager.
Frequently Asked Questions
What is an equity factor in investing?
An equity factor is a stock characteristic used to predict returns, and stocks are sorted on it into groups such as top, middle and bottom thirds. In the Jensen, Kelly and Pedersen study, 153 such factors were grouped into 13 themes based on high within-theme return correlations and conceptual similarities. Factor performance is typically measured by the gross return of a hedge portfolio that is long the highest expected-return stocks and short the lowest.
Do most published equity factors actually replicate?
Most published equity factors do replicate under the refined methodology of Jensen, Kelly and Pedersen, with 84.9% of 153 factors replicating across 93 countries (U.S. data from 1926, most developed countries from 1986, through 2019). A non-trivial but not disastrous minority fail, and 10 of 13 factor themes replicate, the exceptions relating to size, seasonality and leverage. World factor gross alphas are often over 0.3% per month.
How do researchers test whether equity factors replicate across countries?
Each month, for each factor in each country, stocks are sorted into thirds using breakpoints from non-micro stocks, and capped value-weighted gross returns are computed for each third. A hedge portfolio goes long the third with the highest expected return and short the lowest, and its 1-factor gross alpha is estimated by regression against the country portfolio. A Bayesian model then tests the joint behavior of all factors, replacing a conventional multiple-testing correction (84.0% replication versus 77.3%).
Is post-publication decay in factor returns evidence of data snooping?
Post-publication decay in factor alphas is not necessarily evidence of data snooping, according to Jensen, Kelly and Pedersen, who describe it as an expected outcome of Bayesian learning. Their results support the Bayesian prediction that factors with higher pre-publication alphas have higher post-publication alphas. This contrasts with prior findings that most factors are invalid, which began from a 35% replication rate for 452 published factors.
What are the limitations of the finding that most equity factors are valid?
The findings are based on gross returns, so data costs, monthly portfolio reformation frictions and shorting costs would reduce returns and are likely material compared to the gross alphas found. Capped value weighting, which de-emphasizes the largest stocks, may not represent investor experience, and shorting may not always be feasible as specified. Excluding factors with holding periods longer than one month and the weighting scheme also raise reformation frictions versus the baseline study, and most investors would face fees if delegating to a fund manager.