Trading Calendar – May
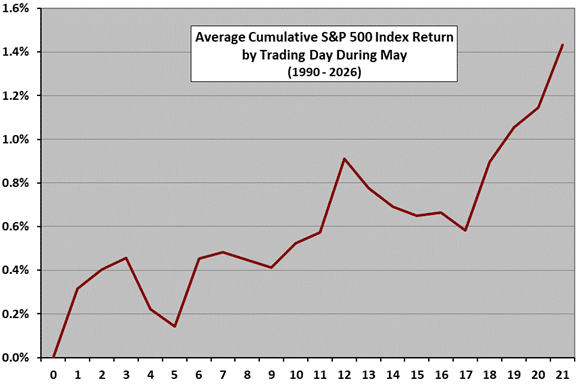
The following chart shows the average month-to-date percentage change in the S&P 500 index by trading day during May from 1990 through 2026. Day 0 represents the April close. It shows that the index during May tends to be positive. We have not used data for trading day 22, because most Mays do not have 22 trading days. Also, sample size is only 27-37 for specific trading days, so these results are only mildly suggestive rather than predictive. For 1990-2026, 28 Mays have been winners and 9 losers.
Return to the Trading Calendar to find other monthly profiles.