
Value and momentum are two very different equity investing styles, both with many adherents. Neither outperforms the overall market all the time. Is there some systematic way of combining these two approaches to enhance consistency of outperformance in global equity markets? In their March 2006 paper entitled “Generating Excess Returns through Global Industry Rotation”, Geoffrey Loudon and John Okunev examine different investing styles (momentum, value, combination of value and momentum, and growth) to exploit cyclic industry returns, with the U.S. yield curve as the critical economic indicator. Using monthly global prices, dividends, earnings and returns data for 36 industries for 1973-2005, they conclude that:
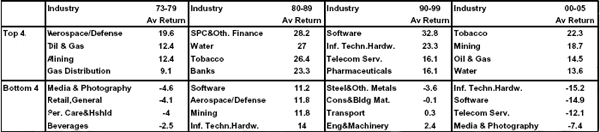
- Industry leadership has varied considerably during 1973-2005 (see first table below), and industry effects may now be more important than country effects with respect to variability of global equity returns.
- The industries with the highest earnings yields outperform those with the lowest. However, value-focused strategies performed poorly in the 1990s.
- Industries with the highest growth rates outperform those with the lowest. However, growth has not worked well in the 2000s.
- The most effective momentum strategy focuses on industries with the highest 12-month trailing returns. However, momentum-focused strategies performed poorly in the 1970s and (so far) 2000s.
- When the U.S. yield curve is normal the top performing industries (average 15.2% return per year) are Tobacco, Water, Aerospace/Defense, Information Technology and Food & Drug Retailers, and the bottom industries (average 10.3% return per year) are Forestry/Paper, Mining, Steel & Other Metals, Diversified Industries and Chemicals. The best (worst) investing strategy is momentum (value).
- When the yield curve is inverted the top performing industries (average 14.0% return per year) are Mining, Water, Tobacco, Oil and Gas and Forestry/Paper, and the bottom industries (average -17.2% return per year) are Information Technology, Media & Photography, Household Goods, Autos and Software. The best (worst) investing strategy is value (momentum).
- Combining the industries with the best value and highest momentum significantly enhances returns overall and for all decades except the 1980s.
The following table, taken from the paper, shows that the top-performing and bottom-performing industries vary considerably from decade to decade. In particular, 1990-1999 was a “momentum” decade.
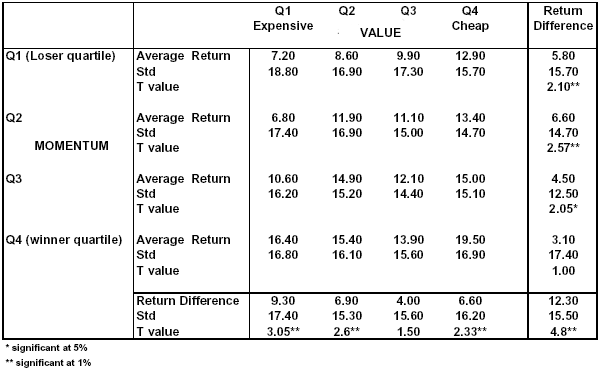
The next table, also taken from the paper, compares the performances of 16 groups of industries defined by both momentum and value characteristics. It shows that cheap, high-momentum equities outperform, with the best group beating the worst by more than 12% per year.
In summary, investors can enhance returns by combining value and momentum styles, leaning toward momentum when the yield curve is normal and value when the yield curve is inverted.
This research should be of particular interest to investors who use industry-focused Exchange Traded Funds.
Frequently Asked Questions
What is global industry rotation in equity investing?
Global industry rotation is a strategy that shifts equity exposure among industries to exploit cyclic differences in industry returns. In the Loudon and Okunev study, it was applied across 36 global industries from 1973 to 2005 using momentum, value, growth, and combined value-momentum styles, with the U.S. yield curve as the key economic indicator.
Does combining value and momentum improve industry returns?
Combining value and momentum significantly enhances industry returns overall and in every decade of 1973-2005 except the 1980s. Among 16 industry groups sorted by momentum and value, the best group (cheap, high-momentum industries) beat the worst by more than 12% per year.
How does the yield curve determine whether to use value or momentum for industry selection?
The U.S. yield curve signals which style to emphasize: momentum is the best strategy and value the worst when the curve is normal, while value is best and momentum worst when the curve is inverted. The study tested this using monthly prices, dividends, earnings, and returns for 36 global industries from 1973 to 2005. Industries were ranked by earnings yield (value), 12-month trailing return (momentum), and growth.
How do value, momentum, and growth strategies compare for picking industries?
Value (industries with the highest earnings yields), growth (highest growth rates), and momentum (highest 12-month trailing returns) each outperformed their lowest-ranked counterparts, but none worked in every period. Value performed poorly in the 1990s, growth has not worked well in the 2000s, and momentum performed poorly in the 1970s and the 2000s (as of the 2005 data). Combining value and momentum produced the strongest results.
Why do single-style industry strategies like value or momentum fail in some periods?
Single-style industry strategies are inconsistent because industry leadership varied considerably across decades from 1973 to 2005, so no style outperformed all the time. The 1990s were a momentum decade in which value-focused strategies did poorly, while momentum struggled in the 1970s and 2000s. Even the combined value-momentum approach did not enhance returns in the 1980s.