Do round numbers have a special meaning for stock traders? If so, is there a way to exploit any associated trading tendencies? In their 2007 paper entitled “Round Numbers and Security Returns”, Edward Johnson, Nicole Johnson and Devin Shanthikumar examine returns (calculated based on midpoints of subsequent closing bid and ask prices) after closing prices that are just above or just below round numbers. Using closing price and closing bid-ask data and firm characteristics for a broad sample of U.S. stocks during the post-decimalization period of 5/01-12/06, they conclude that:
- Since decimalization, main (secondary) cluster points are stock prices that end in one or more zeros (5 or 25).
- In general, daily returns are relatively high (low) after prices close just above (below) a round number. The magnitude of the return difference varies with the type of round number and with the subsample, typically falling between 5 and 20 basis points per day (roughly 15% to 75% annualized). Return differentials are strongest around the “roundest” numbers.
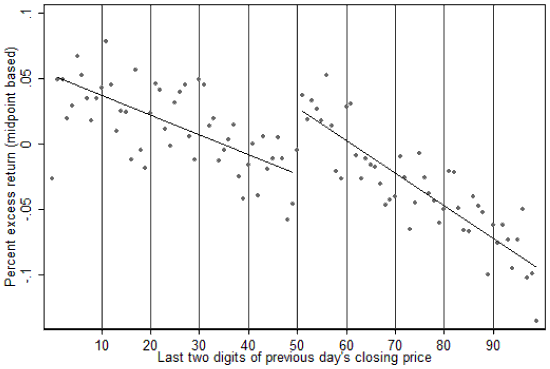
- Specifically, average daily returns for stocks after prior closing prices ending in 01 through 09 cents are 13 basis points higher than those ending in 91 through 99 cents. (See the first chart below.)
- Since 2001, clustering of stock prices near round numbers decreases noticeably, but the above/below round number return effect persists across subsamples based on year.
- The above/below round number return effect is significantly stronger for small and medium-sized firms than for large ones.
- Given the almost-daily rebalancing required, it is probably unprofitable to use this effect as a standalone trading system. However, traders might positively impact overall returns by using it to help time buy and sell decisions.
The following scatter plot, taken from the paper, relates next-day excess returns (based on the midpoint of next-day closing bid and ask) to the last two digits of the previous-day closing price. It includes best-fit regression lines above and below the secondary round number of 50 cents. The chart shows the tendency of next-day returns to be significantly higher (lower) after closes just above (below) round numbers. It also shows that the effect is stronger for rounder numbers (00 cents compared to 50 cents).

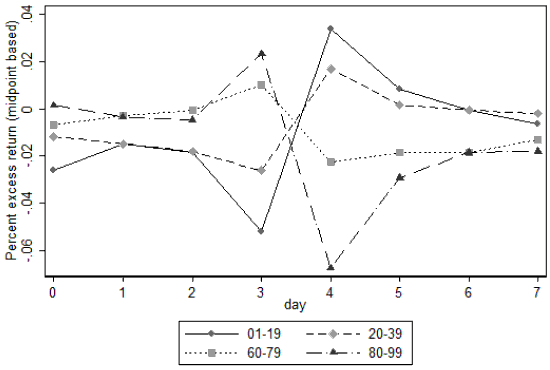
The next chart, also from the paper, depicts daily returns for the four trading days before and the four trading days after a closing price “event” according to the last two digits of that closing price on day 3 (grouped as 01-19, 20-39, 60-79, and 80-99 cents). The large up (down) spike on day 4 for group 01-19 (80-99) is the above/below round number effect described above. Note that this pattern represents a reversal of the day 3 return and that the pattern persists with statistical significance (while fading) for a few days after day 4.

In summary, short-term returns are on average significantly higher (lower) following closing prices that lie just above (below) a round number. The effect is probably of ancillary use only to traders.