Does lack of search activity point to stocks that are out of favor and therefore undervalued? In their November 2015 paper entitled “In Search of Alpha-Trading on Limited Investor Attention”, Konstantin Storms, Julia Kapraun and Markus Rudolf develop and test three trading strategies that employ Google search volumes to take long positions in S&P 500 stocks receiving abnormally low investor attention over the past week (Sunday through Saturday). For each stock, search criteria consist of the firm name and the word “stock.” Abnormally low means below the median search volume of the preceding eight weeks. The baseline strategies are:
- Main – Buy any stock with abnormally low prior-week search volume at the Monday open and hold until the Friday close.
- Loser – Buy any stock with abnormally low prior-week search volume and a negative prior-week return at the Monday open and hold until the Friday close.
- Fear – If VIX rises from two weeks ago to the prior week, buy any stock with abnormally low prior-week search volume at the Monday open and hold until the Friday close.
In robustness tests, they consider sample subperiods, different holding intervals (monthly and daily), searching on ticker rather than firm name and trading frictions. Using weekly Google search volumes for 122 S&P 500 stocks and daily search volumes 66 S&P 500 stocks during January 2004 through October 2014, they find that:
- Over the entire sample period, the Main, Loser and Fear strategies generate, respectively (see the chart below):
- Average gross annual returns 19.3%, 23.6% and 18.1%, compared to 5.2% for the S&P 500 Index.
- Gross annual Sharpe ratios 0.83, 0.94 and 1.00, compared to 0.21 for the S&P 500 Index.
- Gross annual four-factor (market, size , book-to-market, momentum) alphas 10.0%, 14.9% and 11.8%.
- Results are largely, but not uniformly, robust for subperiods, alternative holding intervals of one day or one month and substitution of similar search terms.
- Regarding net results:
- Over the entire period, the average bid-ask spread of all 122 stocks in the weekly sample is 0.11%, translating to 5.5% worst-case annualized round-trip friction for a weekly holding interval.
- Retail investors who additionally bear a per-trade fee of $10 on an average 70 trades per week (3,640 trades per year) would need at least $264,000 in capital to break even.
- Based only on bid-ask spread friction, a monthly holding interval is best for the Main strategy, while weekly is best for the Loser and Fear strategies.
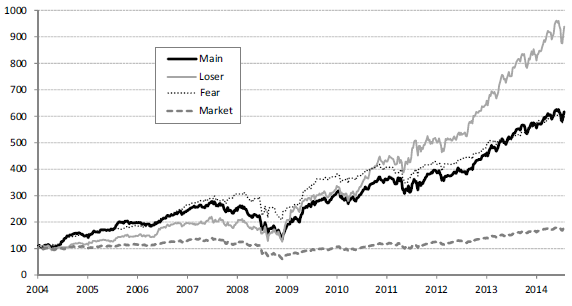
The following chart, taken from the paper, compares gross cumulative values of $100 initial investments in each of the Main, Loser and Fear strategies with a weekly holding interval and in the S&P 500 Index. Terminal values are $617, $939, $598 and $180, respectively. Sharpe ratio is highest for the Fear strategy because of its relatively low volatility.
In summary, evidence indicates that investors may be able to exploit investor inattention to individual U.S. stocks by buying and holding stocks with abnormally low search volumes for short intervals.
Cautions regarding findings include:
- As noted, headline performance statistics are gross, not net. Trading frictions are material and may be prohibitive for many individual investors.
- Strategies involve considerable data collection/processing/trading. Investors delegating these tasks would bear fees.
- Testing multiple strategies on the same data impounds snooping bias, such that the best-performing strategy overstates expectations.