Is proximity to doom good or bad for the U.S. stock market? To measure proximity to doom, we use the Doomsday Clock “Minutes-to-Midnight” metric, revised intermittently in late January via the Bulletin of the Atomic Scientists, which “warns the public about how close we are to destroying our world with dangerous technologies of our own making. It is a metaphor, a reminder of the perils we must address if we are to survive on the planet.” Using the timeline for the Doomsday Clock since inception in 1947 and contemporaneous end-of-year levels of the S&P 500 Index through 2025, we find that:
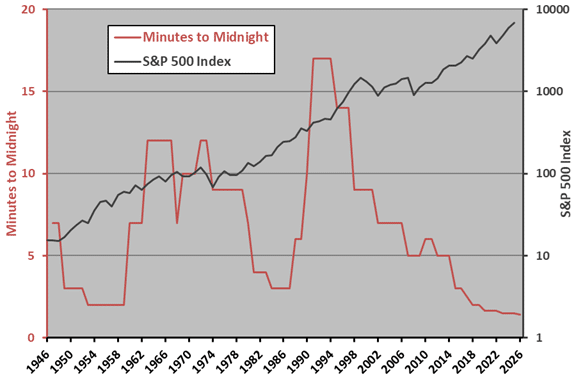
The following chart tracks “Minutes-to-Midnight” and the S&P 500 Index on a logarithmic scale over the available sample period. There is no visually obvious relationship between the two series. Average annual “Minutes to Midnight” is 6.7 minutes, and the series does not clearly trend upward or downward (so may have a stable mean).
For precision, we relate annual “Minutes to Midnight” to annual S&P 500 Index return.
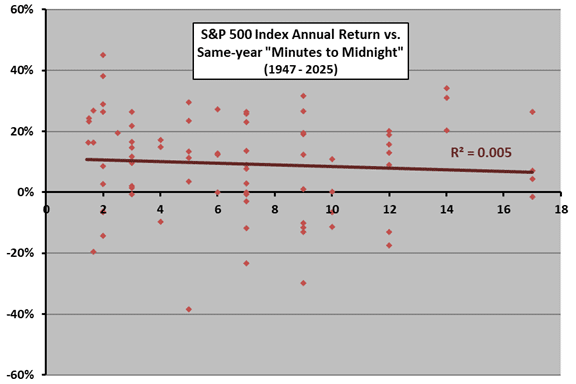
The next chart relates annual S&P 500 Index return to same-year “Minutes to Midnight” judgment as available over the sample period assuming that “Minutes to Midnight” is the same as the most recently issued judgment when there is no annual (January) change. For example, the proximity to doom for 2013 and 2014 is the same as that for 2012.
The Pearson correlation between these two series is -0.07 and the R-squared statistic 0.005, indicating practically no relationship between proximity to doom and annual U.S. stock index return. If anything, being closer to doom is a tiny bit better for stocks.
Might there be a lag between proximity to doom and stock market return?
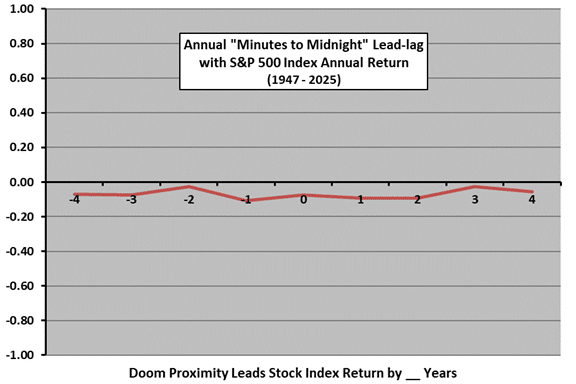
The next chart summarizes annual correlations between annual “Minutes to Midnight” and annual S&P 500 Index return for lead-lag relationships, ranging from S&P 500 Index return leads proximity to doom by four years (-4) to proximity to doom leads S&P 500 Index return by four years (4).
All correlations are very small, suggest no power of proximity to doom to predict U.S. stock market behavior. If anything, the relationship is slightly negative, so proximity to doom is slightly good for stocks.
In summary, evidence from simple tests on limited data does not support belief that proximity to doom as judged by the Bulletin of the Atomic Scientists is relevant to U.S. stock market returns.
Cautions regarding findings include:
- The number of judgments for proximity to doom is small in the context of stock market return variability, so confidence in findings is low.
- The Bulletin of Atomic Scientists may not be representative of investors (or even of atomic scientists) regarding outlook for doom.
- The “Minutes to Midnight” metric may be too vague for investors to interpret.
The doom concept does, however, have its uses.