Do stock scammers use Twitter to manipulate prices of microcap stocks? In his August 2017 paper entitled “Market Manipulation and Suspicious Stock Recommendations on Social Media”, Thomas Renault performs an event study to analyze returns for microcap stocks around spikes in Twitter activity about the stocks. He identifies tweets about a stock as those containing a dollar sign ($) before its ticker. He identifies Twitter spike events as daily activity (from market close to market close) that exceeds the average of the prior seven days by two standard deviations, with a minimum of 20 tweets from 20 distinct users. He assigns any event occurring on a non-trading day to the next trading day. His baseline analysis is for stocks priced over $0.10 and market capitalization over $1,000,000 at the beginning of the event window, but he tests other thresholds. He considers several ways to define abnormal returns and uses the NASDAQ MicroCap Index as the market return. Using SEC litigation releases during 1996 through 2015 for background and tweet and return data for Over-The-Counter (OTC) microcap stocks during October 5, 2014 through September 1, 2015, he finds that:
- Per the SEC data, pump-and-dump schemes mainly target OTC microcaps. Manipulators often combine a false or misleading press release with touts of a stock via emails, websites, bulletin boards and fax blasts. Prosecuted cases target firm insiders (CEO, CFO), stock promoters paid in cash or in shares and traders/shareholders.
- Abnormally high Twitter activity is associated with a large price increase on the event day, followed by sharp reversal over the next week.
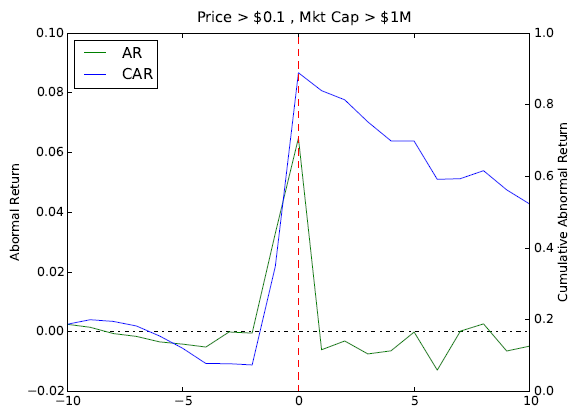
- For stocks with price over $0.10 and market capitalization over $1 million at the beginning of the event window, average abnormal return (see the chart below):
- On the day before event day is 3.1%.
- On the event day (day of the Twitter spike) is 6.5%.
- Over the next five days is negative, for a cumulative -2.5%.
- Decreasing (increasing) the price and market capitalization thresholds amplifies (dampens) this event pattern.
- There are five clusters of Twitter users during these events characterized by very high levels of interactions among themselves and low level of interactions with other Twitter users. These clusters appear to drive Twitter spikes via tweets and retweets from fake accounts.
The following chart, taken from the paper, tracks average daily abnormal returns (AR) and cumulative abnormal returns (CAR) from 10 trading days before through 10 trading days after Twitter spikes as defined for OTC stocks with price over $0.10 and market capitalization over $1,000,000 at the beginning of the event. AR is significantly positive the day before and the day of the Twitter spike, but mostly negative thereafter.
The pattern is similar, but more (less) pronounced for lower (higher) price and market capitalization thresholds.
Presumably, manipulation involves accumulation prior to, and liquidation during, the Twitter spikes.

In summary, evidence suggests that manipulators use Twitter “blasts” to attract attention of traders and thereby temporarily drive up the price of OTC stocks.
Cautions regarding findings include:
- The sample period is very short for testing robustness of findings.
- Exploitation of the fade in stock price after Twitter spikes may be problematic (for those who do not know about the spike ahead of time) due to the difficulty of shorting such stocks.