During a crisis, do investors overreact in reallocating funds from risky assets (stocks) to safe 13-week Treasury bills (T-bill), with stock prices and T-bill yields consequently falling together? Once the crisis abates, do investors cthen orrect their overreaction by moving funds back from T-bills to stocks, with stock prices and T-bill yields then rising together? To test this model of investor behavior, we examine relationships between overall stock market returns and T-bill yield changes during and after dramatic declines in the T-bill yield for past and future intervals of 10, 21 and 63 trading days. Using daily closes for the S&P 500 index and T-bill yield from 1/4/60 through 8/20/07 (11,864 days when both traded), we find that:
In the analyses that follow, the change in T-bill yield is fractional. For example, a decrease in the yield from 4% to 3% is a change of -25%, not -1%.
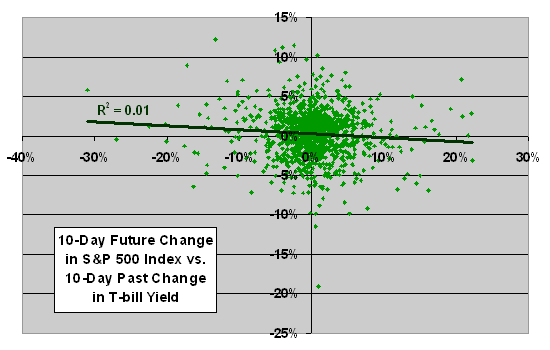
The following scatter plot relates the 10-day future return on the S&P 500 index to the change in the T-bill yield over the past 10 days. To construct this plot, we select data for every tenth trading day to avoid sample overlap (1185 independent observations). As hypothesized, it appears that there is some tendency for stocks to rise after the T-bill yield has declined. However, the Pearson correlation for the entire sample is just -0.08 and the R-squared statistic is 0.01, indicating that changes in the T-bill yield over the past two weeks explain only about 1% of the movement in stock prices over the next two weeks.
A similar plot relating the 10-day future change in the T-bill yield to the change in T-bill yield over the past 10 days shows a very slight tendency (Pearson correlation 0.06 but R-squared statistic 0.00) for continuation of yield trends, rather than reversal as hypothesized, over the next two weeks.
Another similar plot relating the 10-day return on the S&P 500 index to the change in the T-bill yield over the same 10 days shows a very slight tendency (Pearson correlation -0.07 and R-squared statistic 0.01) for stock prices and T-bill yield to move in opposite directions, rather than the same direction as hypothesized, over a given two-week period.
The hypothesis does not fare well for 10-day intervals over the entire sample. Might there be ranges of change in the T-bill yield which relate more strongly to future stock returns?
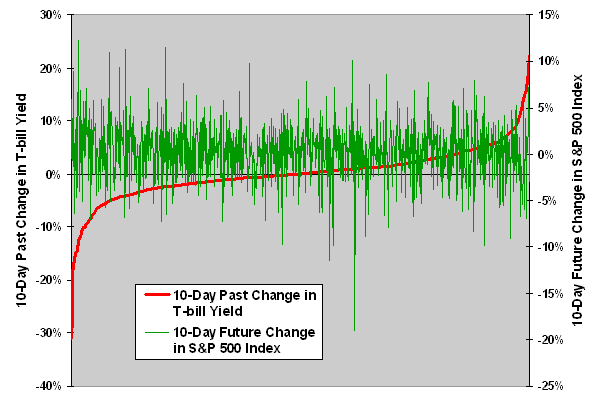
The next chart is an ordered version of the prior scatter plot arranged from the largest 10-day drop (-31%) to the largest 10-day gain (+22%) in the T-bill yield. This chart reinforces a conclusion that the relationship between past changes in T-bill yield and future stock returns is very noisy. There are no obvious ranges of the change in T-bill yield that reliably predict future change in the S&P 500 index.
Might focusing on the most dramatic plunges in T-bill yields tease out a reliable relationship?
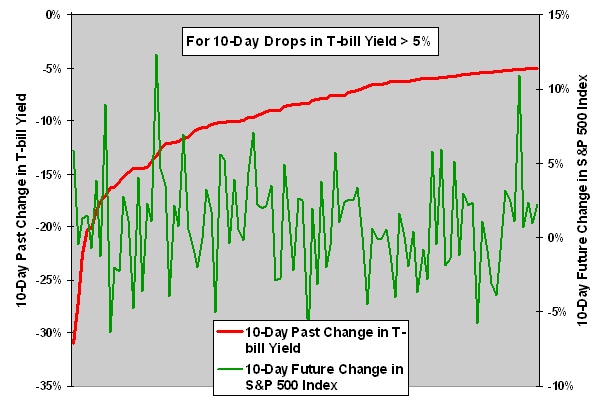
The next chart focuses on the extreme left-hand edge of the preceding one, presenting only those data for which the T-bill yield has fallen by at least 5% over the past 10 trading days (103 instances). The response of the S&P 500 index over the next two weeks remains noisy and largely trendless.
Might the relationship between changes in T-bill yield and stock returns be stronger for one-month intervals?
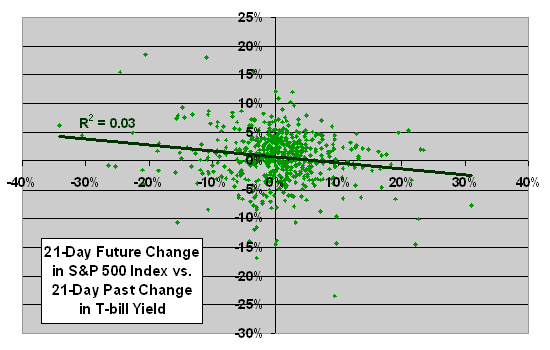
The next scatter plot relates the 21-day future return on the S&P 500 index to the change in the T-bill yield over the past 21 days. To construct this plot, we select data for every 21st trading day to avoid sample overlap (563 independent observations). Again, it appears that there is some tendency for stocks to rise after the T-bill yield has declined. The Pearson correlation between the two series is -0.17, and the R-squared statistic is 0.03, indicating that monthly changes in the T-bill yield explain only about 3% of the movement in stock prices over the next month.
A similar plot relating the 21-day future change in the T-bill yield to the change in T-bill yield over the past 21 days shows some tendency (Pearson correlation 0.19 but R-squared statistic 0.04) for continuation of yield trends, rather than reversal as hypothesized, over the next month.
Another similar plot relating the 21-day return on the S&P 500 index to the change in the T-bill yield over the same 21 days shows a very slight tendency (Pearson correlation -0.07 and R-squared statistic 0.00) for stock prices and T-bill yields to move in opposite directions, rather than the same direction as hypothesized, over a given month.
The hypothesis still does not fare well overall for a 21-day interval. Might focusing on the most dramatic 21-day plunges in T-bill yields expose a useful relationship?
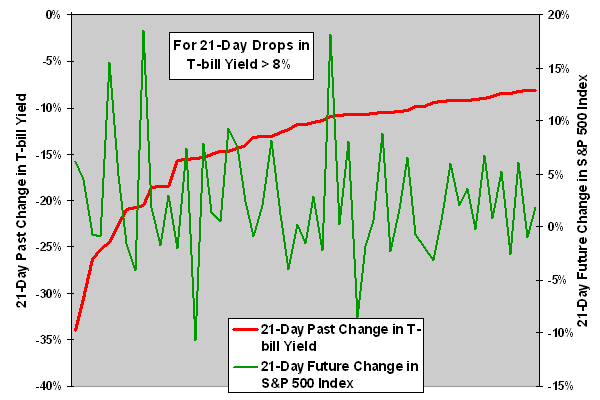
The next chart focuses on those data for which the T-bill yield has fallen by at least 8% over the past 21 trading days (55 instances). The response of the S&P 500 index over the next month is still noisy and largely trendless.
Might the relationship between changes in T-bill yield and stock returns be stronger over a three-month interval?
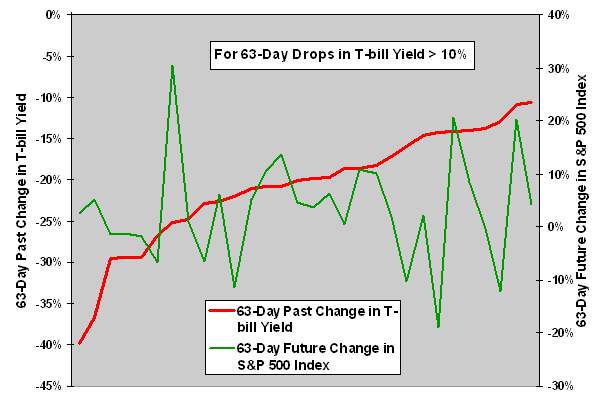
The relationships between changes in T-bill yield and stock returns are generally weaker for 63-day past and future intervals than for 21-day intervals. The final chart focuses on those data for which the T-bill yield has fallen by at least 10% over the past 63 trading days (30 instances). The response of the S&P 500 index over the next three months is still noisy and largely trendless.
However, the tendency for continuation of the trend in T-bill yield is somewhat stronger for 63-day past and future intervals (Pearson correlation 0.27 and R-squared statistic 0.07), again in conflict with the hypothesis.
In summary, evidence does not support a model of funds flowing predictably back and forth between stocks and T-bills as investors overreact and correct to perceived crises.