Do stock return anomalies weaken after discovery? If so, why? In the February 2016 update of their paper entitled “Does Academic Research Destroy Stock Return Predictability?”, David McLean and Jeffrey Pontiff examine out-of-sample and post-publication performance of 97 predictors of the cross section of stock returns published in peer-reviewed finance, accounting and economics journals. For each predictor, published confidence in predictive power is at least 95%, and replication is feasible with publicly available data. The publication date is year and month on the cover of the journal. Their goal is to determine the degrees to which any future degradation in predictive power derives from: (1) statistical biases (exposed out-of-sample but pre-publication); and, (2) market adaptation to strategies used by investors to exploit anomalies (exposed post-publication). For each predictor and interval, they employ a consistent test methodology based on average monthly return for a hedge portfolio that is long (short) the fifth of stocks with the highest (lowest) expected returns based on the original study. Portfolios are equally weighted unless the original study uses value weighting. Using extensions to 2013 of the exact or best available approximations of original data for the 97 predictive variables with samples starting as early as 1926 and ending as late as 2011, they find that:
- Regarding replicated predictor tests over published sample (in-sample) periods:
- Average publication year is 2000.
- Average sample duration is 323 months.
- 12 of 97 predictors fail to reach the 95% confidence claimed at publication.
- Average gross monthly hedge portfolio return is 0.58%.
- Average return for the last 12 months of these data is higher than that for older in-sample data, suggesting the possibility of bias in selecting the sample end date.
- Regarding out-of-sample extensions of predictor tests from the end of the published sample period to the publication date:
- Average sample duration is 56 months.
- Average gross monthly hedge portfolio return is 0.40% (26% lower than in-sample).
- However, there is on average no degradation of in-sample return during the first 12 months out-of-sample, suggesting anomaly momentum.
- Regarding out-of-sample extensions of predictor tests from publication date to 2013:
- Average sample duration is 156 months.
- Average gross monthly hedge portfolio return is 0.26% (58% lower than in-sample, suggesting a 32% decline due to post-publication trading).
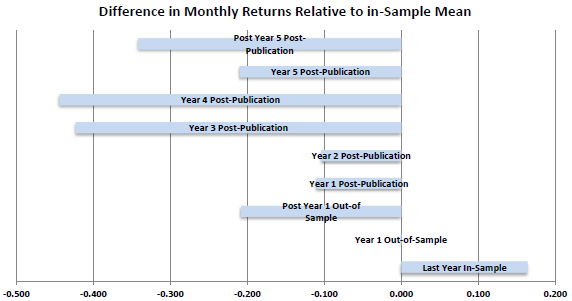
- The largest degradation relative to in-sample performance occurs three to four years after publication (see the chart below), suggesting that it takes time for investors to devise and implement exploitative strategies.
- Post-publication performance degradation is persistent over the aggregate sample period.
- Degradation relative to in-sample performance is greater for predictors with: (1) higher in-sample returns (which tend to concentrate stocks with high idiosyncratic risk and low liquidity); (2) higher in-sample confidence levels; and, (3) dependence only on technical (price and trading) data.
- After publication, the correlation of a predictor’s portfolio return with those for other published (yet-to-be-published) predictor portfolios increases (decreases), suggesting coordinated post-publication trading.
- Trading volumes and differences in short interest between stocks in the short and long sides of stocks in predictor portfolios increase after publication, suggesting that investors pay attention to academic research.
- Findings are similar when using library receipt dates or first appearance on the Social Science Research Network (SSRN) as publication date.
The following chart, taken from the paper, summarizes average predictor hedge portfolio return relative to in-sample return for nine intervals commencing one year before the end of original in-sample periods. Results indicate that:
- The last year of the original sample exhibits unusually strong performance, suggesting that researchers are drawn to recent strong performance or they intentionally pick a favorable end date.
- The first year out-of sample performs about the same as in-sample, arguing against in-sample statistical biases and/or for momentum in predictor relationships.
- Subsequent out-of-sample performance exhibits degradation, arguing for in-sample statistical biases and/or pre-publication dissemination of findings to some investors.
- Performance during each of the first five years after publication and subsequent performance exhibit degradation, most strongly during years three and four, suggesting that it takes time for investors to learn about findings and devise/implement exploitative strategies.
Confidence in these findings is low compared to those for full in-sample, out-of-sample and post-publication periods.
In summary, evidence indicates that investors should expect to capture less than half the gross return reported in published studies of new stock market anomalies (even less after bearing trading frictions).
Cautions regarding findings include:
- As noted in the paper, perfect replication is not possible for all predictors due to changes in source data and imprecision of original predictor specifications.
- In general, stock market anomalies described in journals are gross of trading frictions and shorting costs/obstacles, so the post-publication returns described in this study are presumably gross as well. Including such costs may substantially affect findings by predictor (different portfolio turnovers) and time frame (changing trading frictions). Some studies consider stock liquidity measures to assess import of this concern.