
Is there a common factor explaining multiple widely accepted stock return anomalies? In the March 2010 version of their paper entitled “Do Five Asset Pricing Anomalies Share a Common Mispricing Factor?Multifaceted Empirical Analyses of Failure Risk Proxies, External Financing, and Stock Returns” , Joseph Ogden and Julie Fitzpatrick investigate the ability of a single factor, involving operating profit and external financing, to explain five stock return anomalies: (1) the failure-risk anomaly; (2) earnings momentum; (3) the external financing (stock buybacks/secondary offerings) anomaly; (4) the accruals anomaly; and, (5) the book-to-market anomaly. Using monthly stock return and firm fundamentals data for a broad sample of U.S. stocks to form 205 portfolios over the period 1974-2008 (60,301 firm-year observations), they find that:
- Evidence suggests that the size effect derives largely from rational risk pricing, while most of the above five anomalies derive largely from irrational mispricing.
- Firm size and one mispricing factor common to all five of the above anomalies drive the variation in stock returns.
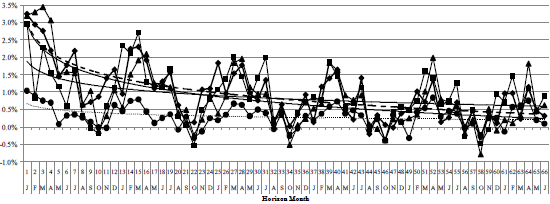
- Evidence from market/size-adjusted hedge portfolios that are long/short extreme quintiles on mispricing-related factors indicates strong seasonality, with an annually repeating maximum during January-April and minimum during August-November (see chart below). In other words, the anomalies work during January-April but not during August-November.
- Stock price “hyping” in advance of stock issuance is a plausible explanation for the common mispricing factor. Arbitrage costs may inhibit investors from correcting mispricing quickly.
The following chart, taken from the paper, shows average monthly market/size-adjusted returns for hedge portfolios formed on various mispricing-related factors over the 66 months after year-end portfolio formation during 1974-2006. Each series represents a different mispricing-related factor (such as book-to-market ratio). Results indicate an annual seasonality to mispricing, with anomalies working most effectively during January-April and not working during August-November. The authors guess that seasonality is related to correction of mispricings with releases of annual (10-K) financial reports during January-April.
In summary, investors may be able to streamline the search for anomalous returns by focusing on two factors: (1) firm size, representing the rational risk of failure; and, (2) a seasonal factor related to operating profit and buybacks-secondaries, representing irrational mispricing.