In a series of nine presentation slide sets (Lectures 1-9 of 10) on “Advances in Financial Machine Learning”, Marcos Lopez de Prado provides part of Cornell University’s ORIE 5256 graduate course at the School of Engineering (“Special Topics in Financial Engineering V”). The course description includes: “Machine learning (ML) is changing virtually every aspect of our lives. As it relates to finance, this is the most exciting time to adopt a disruptive technology that will transform how everyone invests for generations [see the chart below]. Students will learn scientifically sound ML tools used in the financial industry.” Key points in these slide sets include:
- “Financial Machine Learning”
- Machine learning is statistics for the age of computing, tackling complex patterns driven by many variables without specific direction.
- Machine learning lets the data speak with minimal assumptions, but its solutions are not simple algebraic functions.
- Machine learning portfolio solutions can outperform mean-variance optimization and equal weights, boosting Sharpe ratio over 31%.
- Machine learning is effective for signal generation, detecting pattern change, bet sizing, outlier detection, replicating human analyst recommendations and and identifying when prices are most sensitive to sentiment imbalance.
- However, machine learning invites backtest overfitting. It should be used to discover what factors are important in support of theory development.
- “Data Analysis”
- Measure in intervals of information arrival (such as trading volume or dollars traded) rather than calendar time.
- Account for profit-taking, stop-outs and margin calls in backtests.
- Model position direction and position size separately.
- Weight observations according to uniqueness (e.g., penalizing overlapping measurements).
- Use fractional differentiation to combine information in price series and return series.
- “Modeling”
- Combine signals of distinct predictors to reduce output variance and bias via bootstrap aggregation (bagging), random forest or boosting methods.
- Rigorously exclude all in-sample (training) data from the out-of-sample test dataset, with focus on variables formed from overlapping observations.
- Identify the behavioral implications of each feature of a model that would reasonably support its effectiveness.
- Test each feature of a model independently to assess its importance.
- Cross-validate to optimize hyper-parameter settings (those pre-set by the researcher and not adjusted during in-sample learning).
- “Backtesting I”
- Size positions according to predicted probabilities of win and loss.
- Update positions with new information by averaging across active positions.
- Impose discrete steps on trade triggers to avoid overtrading.
- Backtesting is fraught with uncertainties/randomness, biases and frictions/constraints.
- Develop models for entire asset classes, not individual assets.
- Use bagging to detect overfitting.
- Do not backtest until supporting research is complete.
- Keep track of backtests used on each dataset.
- Test many simulated scenarios (cross-validation), not just one history (a single walk-forward).
- Resist the impulse to tweak a strategy to improve its backtest.
- “Backtesting II”
- Employ a broad range of strategy performance statistics, including time-weighted rate of return, drawdown, time under water, implementation turnover/frictions and various efficiency measures such as Sharpe ratio and versions of Sharpe ratio corrected for non-normal returns, short samples and data snooping bias.
- Track also predicted versus actual outcomes.
- Distinguish between strategies with payouts (wins and losses) that are symmetric and asymmetric.
- Estimate the probability that the overall strategy will fail over time.
- “Machine Learning Portfolio Construction”
- Investors can rarely forecast asset returns with confidence, and small forecast errors can dramatically affect the conventional return-risk efficient frontier (optimal allocations). Abandoning return forecasting leads to risk-based approaches such as risk parity.
- Even after abandoning return forecasting, conventional optimization is unstable and tends to fail (become highly undiversified) during times of market stress.
- A machine learning approach that recursively arrives at optimal allocations to assets organized (clustered) by similarity outperforms both conventional return-risk optimization and risk parity, maintaining diversification under stress.
- “Useful Financial Features”
- Specific machine learning algorithms/tests support identification of structural breaks in time series data, identifying when something unexpected happens and separating noise from signal.
- “High-Performance Computing”
- Supercomputing, vectorization/multithreading/asynchonicity and balancing workload across computing resources support high levels of rapid machine learning.
- “The 7 Reasons Most Machine Learning Funds Fail”
- Asking quants to work independently (in “silos”) rather than as specialists working within a team.
- Working only with returns and ignoring the paths of prices.
- Sampling based on the calendar rather than the information arrival rate.
- Ignoring stop-outs/margin calls and profit-taking rules in backtests.
- Ignoring lack of independence (e.g., overlap) among input data.
- Allowing overlap of training (in-sample) and testing (out-of-sample) datasets.
- Reusing data across multiple tests without accounting for associated data snooping bias.
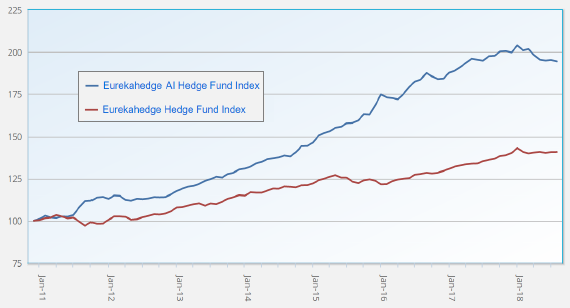
The following chart, taken from the second slide set above, compares cumulative performances of an AI-based hedge fund index and a broader hedge fund index over the past 7+ years. (Gross) Sharpe ratio of the AI-based index is 1.72.
Cautions/observations regarding points include:
- Although presented in the context of machine learning, many principles addressed apply to investment strategy development generally.
- While some of the methods summarized above may be out of their reach, conventional traders should understand their machine learning competition.
- Widespread application of machine learning to investment management may materially alter financial markets, both extinguishing many opportunities and perhaps creating a few new ones.