Are low trading frictions, high trading speed and proliferation of trading strategies elevating market efficiency and thereby extinguishing U.S. stock anomalies? In their March 2012 paper entitled “Trends in the Cross-Section of Expected Stock Returns”, Tarun Chordia, Avanidhar Subrahmanyam and Qing Tong examine the evolution of individual U.S. stock return predictability based on stock/firm characteristics found in the past (mostly during the 1990s) to have predictive power. Characteristics considered include: size; book-to-market ratio; share turnover; cumulative return over five months ending one month ago; cumulative return over six months ending six months ago; monthly return reversal; stock illiquidity; stock price; analyst forecast dispersion; standardized unexpected earnings; and, accounting accruals. They test anomaly evolution across two subperiods using both regressions and long-short portfolios. Using data as available for NYSE-AMEX common stocks during 1976-2009 (with equal subperiods 1976-1992 and 1993- 2009) and for NASDAQ commons stocks during 1983-2009 (with comparable subperiods 1983-1992 and 1993-2009), they find that:
- As markets have become more active and liquid in the recent subperiod, regressions show that return anomalies generally weaken in magnitude and statistical significance.
- The strengths of commonly applied (size, book-to-market and momentum) risk factors attenuate.
- Both momentum effects weaken, and the share turnover effect disappears.
- Effects derived from dispersion of analyst opinion, standardized unexpected earnings, monthly reversals and accounting accruals are inconsistent in the recent subsample, and completely lose significance for liquid NYSE/AMEX stocks. Liquid Nasdaq stocks also exhibit reduced predictability.
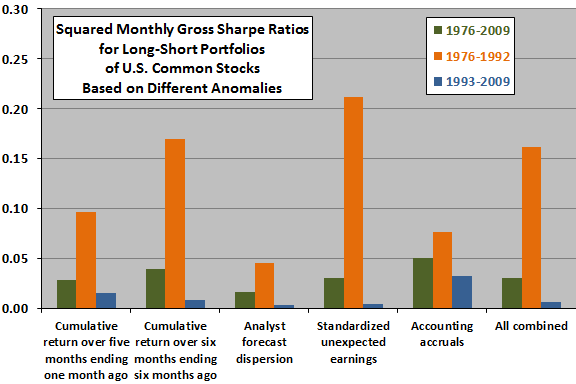
- Reward-risk ratios (measured by squared Sharpe ratios) for portfolios that are long (short) stocks with predicted returns above (below) average, reformed monthly, diminish markedly across subperiods. Significant profitability persists only for less liquid NASDAQ stocks. (See the chart below.)
- Performance of a liquidity-driven one-month reversal portfolio weakens dramatically from a statistically significant 0.8% per month in the early subperiod to an insignificant -0.2% per month in the recent subperiod.
The following chart, constructed from data in the paper, summarizes squared Sharpe ratios for portfolios that are long (short) NYSE/AMEX/NASDAQ common stocks with predicted returns above (below) average, reformed monthly, based on several individual and one combined stock return predictors. For all cases, the reward-risk ratio is much stronger during the early subperiod than the recent subperiod, and statistical significance is mostly lacking during the recent subperiod.
Refined results for the combined indicator show that statistical significance survives into the recent subperiod only for NASDAQ stocks with below-median liquidity.

In summary, evidence indicates that, as trading activity increases, anomalies associated with individual U.S. stock/firm characteristics weaken, both statistically and economically.
Cautions regarding findings include:
- Return and Sharpe ratio calculations are gross, not net. Incorporating realistic trading frictions, which vary considerably over the sample period, would reduce returns (more strongly in the early subperiod) and may alter findings. See “Trading Frictions Over the Long Run”. Trading frictions also vary with stock characteristics.
- Long-short portfolio return calculations do not consider the feasibility or cost of shorting, so results may be unrealistic.