How long does it take stock markets to revert to their long-run means? In their April 2010 paper entitled “Mean Reversion in International Stock Markets: An Empirical Analysis of the 20 th Century”, Laura Spierdijk, Jacob Bikker and Pieter van den Hoek analyze mean reversion in 17 developed countries (Australia, Belgium, Canada, Denmark, France, Germany, Ireland, Italy, Japan, the Netherlands, Norway, South-Africa, Spain, Sweden, Switzerland, United Kingdom and the United States) over 109 years based on annual data. Using annual levels of 17 country stock market indexes and a composite worldwide index during 1900 through 2008, they find that:
- There is no reliable mean reversion for individual country market indexes.
- Over the entire sample period, the worldwide market index on average absorbs half a shock (major deviation from the mean) in about 13.8 years, with the 95% confidence interval ranging from 10.1 years to 21.1 years.
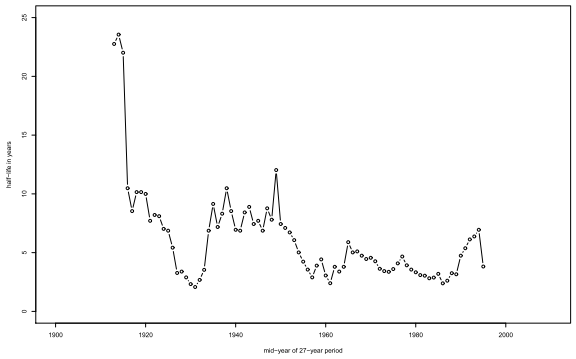
- Based on 83 rolling (overlapping) windows of 27 years, the speed of mean reversion fluctuates, ranging from a minimum of 2.1 years to a maximum of 23.8 years.
- The subperiod encompassing the Great Depression and the start of World War II have the fastest mean reversion.
- The early years of the Cold War, the Oil Crisis of 1973, the Energy Crisis of 1979 and Black Monday in 1987 exhibit relatively fast mean reversion.
- However, in a substantial number of windows there is no significant mean reversion.
- The overall slowness of mean reversion and its huge variability across subperiods severely limit exploitation through a trading strategy.
The following chart, taken from the paper, shows rolling-window estimates of mean reversion half-life for a worldwide stock market index, plotted by the mid-year of the rolling-window time interval. Since 1960, the half-life has been around five years.

In summary, evidence suggests that the speed at which the worldwide equity market reverts to some fundamental value has recently had a half-life of about five years, with reversion higher in periods of great economic uncertainty.
Findings suggest that the speed of mean reversion is likely elevated over the last few years.
Cautions regarding findings include:
- The length of the rolling window interval derives from “eyeballing,” which suggests data snooping bias.
- Because the horizontal axis of the above chart is the midpoint of the window of analysis, the chart read literally has look-ahead bias.