Do strategies modeled using major indexes translate cleanly to the exchange-traded funds (ETF) that track them? ETF returns may deviate from underlying index levels because: (1) ETFs incorporate trading frictions from rebalancing and management fees; (2) ETF composition may differ slightly from that of the underlying index due to trading cost considerations; (3) ETFs accumulate dividends in a non-interest bearing account for periodic lump sum distribution; and, (4) ETFs trade until 4:15 p.m., while indexes close at 4:00 p.m. To investigate, we compare return distribution statistics over rolling 52-week histories for three index-ETF pairs:
SPDR S&P 500 (SPY) versus S&P 500 Index, since late January 1993.
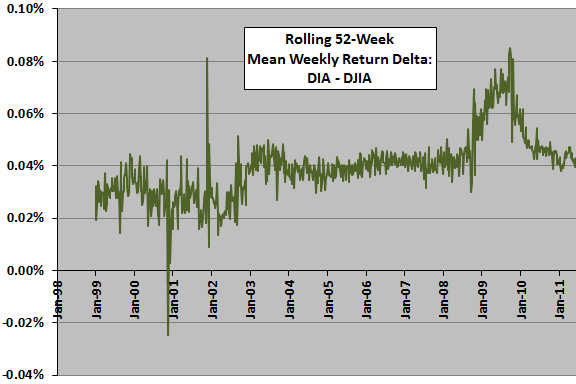
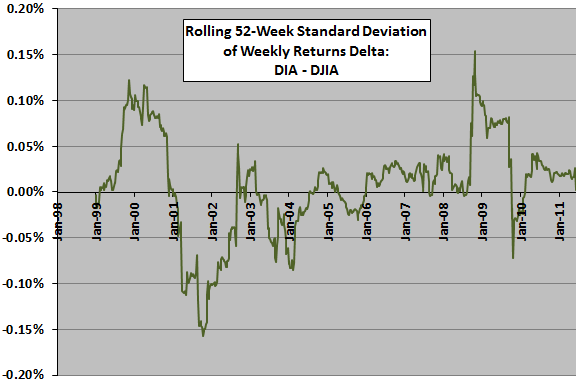
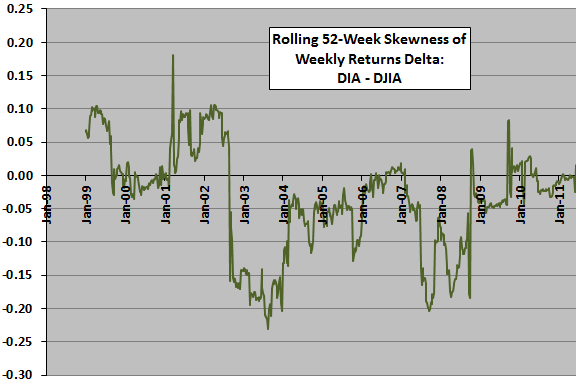
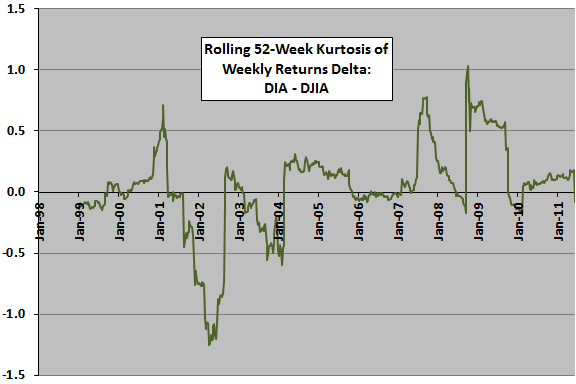
SPDR Dow Jones Industrial Average (DIA) versus Dow Jones Industrial Average (DJIA), since late January 1998.
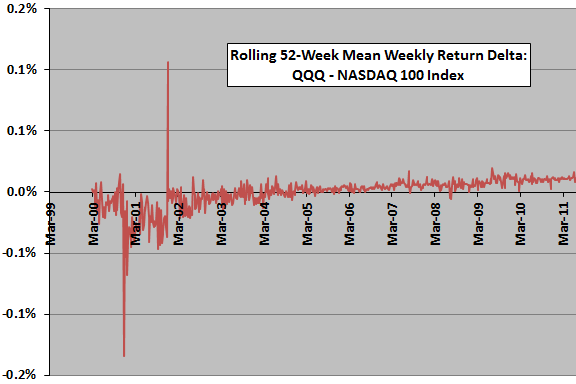
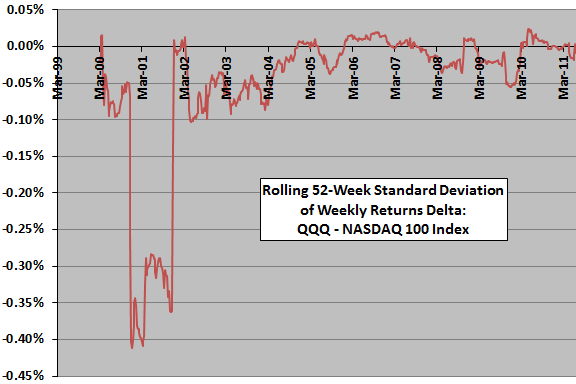
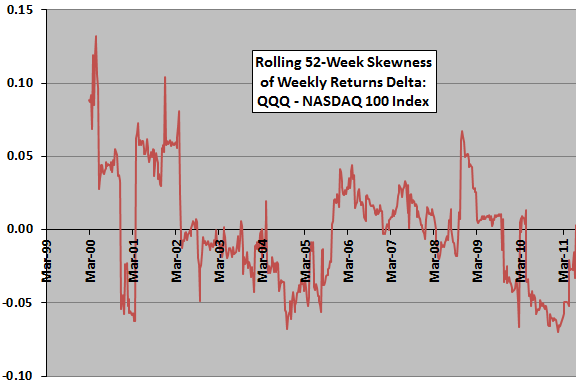
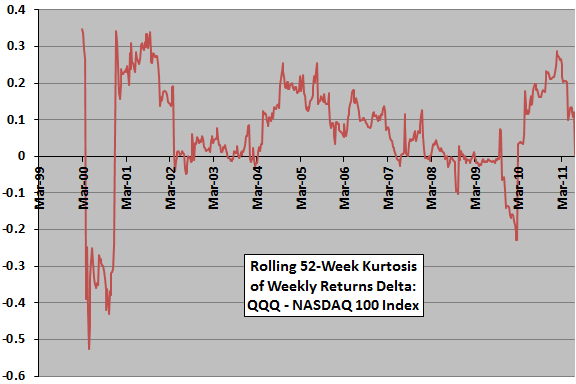
PowerShares QQQ (QQQ) versus NASDAQ 100 Index, since early March 1999.
Using weekly closes for both indexes and dividend-adjusted ETFs from ETF inception through June 2011, we find that:
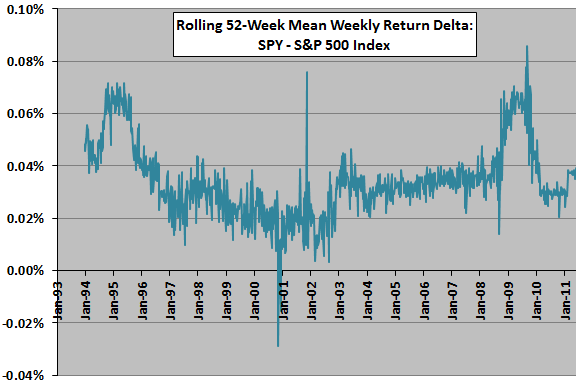
The following chart plots the difference in average weekly returns over the prior 52 weeks between SPY and the S&P 500 Index during the available sample period. The delta is persistently positive due to incorporation of dividends in SPY returns, but it is not constant.
What about deltas for other return distribution statistics?
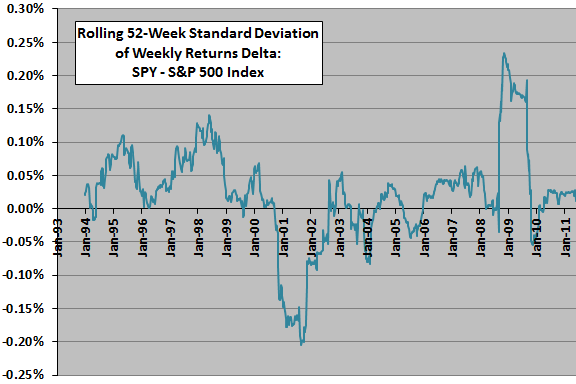
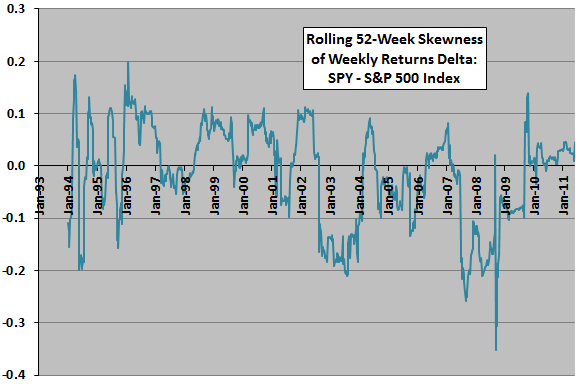
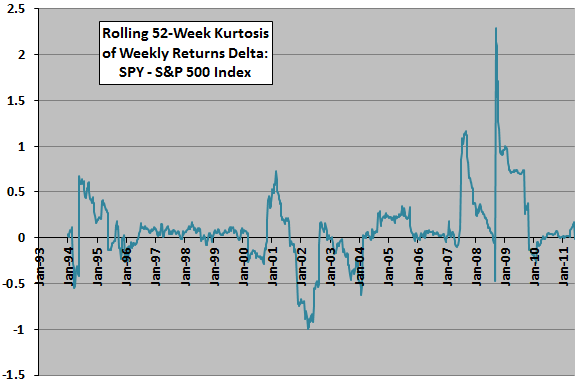
The next three charts plot similar SPY-S&P 500 Index deltas for return distribution standard deviation, skewness and kurtosis over the prior 52 weeks during the sample period. The deltas for these three statistics appear to be roughly zero-reverting, with all exhibiting pronounced extremes associated with the 2008 financial crisis. In other words, the ETF behaves least like its underlying index during the financial crisis.
What about the other two ETF-index pairs?
The following two groups of four charts each summarize results for the other two ETF-index pairs.
For DIA-DJIA (observations above generally apply):
For QQQ-NASDAQ 100 Index (the dividend effect is muted, and there is no obvious disruption associated with the 2008 financial crisis):
In summary, evidence from basic statistics suggests that strategies tested on familiar indexes may not translate perfectly to associated ETFs.
In other words, investors should consider these findings in deciding whether to use indexes to backtest trading strategies while planning to execute the strategies via ETFs (perhaps due to short ETF histories). This consideration is likely most material for strategies that trade frequently.
Cautions regarding findings include:
- Relative to a 52-week measurement interval, the samples are not large.
- As noted, materiality of ETF-index deltas for backtesting likely depends on trading strategy characteristics.