Iterative testing of strategies on a set of data introduces snooping bias, such that a winning (losing) strategy is to some degree lucky (unlucky). Sharing of strategies across a community of researchers carries the luck forward, with accretion of additional bias from testing by subsequent researchers. Is there a rigorous way to account for this accumulation of snooping bias? In the October 2013 version of their paper entitled “Backtesting”, Campbell Harvey and Yan Liu describe three types of adjustment for snooping bias and apply them to quantify the snooping bias “haircut” appropriate for any reported Sharpe ratio (in lieu of a 50% rule-of-thumb discount). Using mathematical derivations and examples, they conclude that:
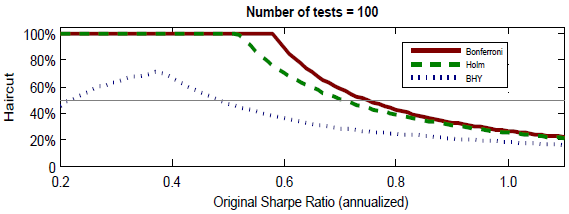
- Across a range of number of test iterations, all three types of snooping bias adjustment penalize marginal strategies heavily because they are likely false discoveries. Specifically (see the chart below), when a strategy’s annualized gross Sharpe ratio is:
- Less than 0.4, the snooping bias haircut is almost always above and sometimes far above 50%.
- Greater than 1.0, the snooping bias haircut is at most 25%.
- Results indicate that a 50% rule-of-thumb Sharpe ratio discount is inappropriately lenient (harsh) for strategies with relatively small (large) estimated gross Sharpe ratios.
The following chart, taken from the paper, illustrates the gross annualized Sharpe ratio snooping bias haircuts (discounts) for 100 test iterations as generated by the three types of adjustment considered, designated by the names of their respective developers: Bonferroni; Holm; and, Benjamini, Hochberg and Yekutieli (BHY). For all three adjustment approaches, haircuts applied to strategies with low estimated Sharpe ratios are percentage-wise much larger than those applied to strategies with very high estimated Sharpe ratios.
The authors advocate the BHY method, unless there is some severe consequence of a false discovery.
In summary, analysis suggests that investors should discount estimated Sharpe ratios of strategies they develop by a lot (little) if the estimated Sharpe ratios are marginally (highly) attractive.
Cautions regarding the proposed approach are:
- As noted by the authors:
- Conventional interpretation of the Sharpe ratio assumes a normal return distribution.
- The most appropriate type of data snooping adjustment and the underlying required confidence level in the Sharpe ratio may vary by investor.
- Without precise tracking of the number of strategies considered, the estimated number of test iterations requires judgment.
- It is arguably impossible to estimate the number of strategy iterations tested and shared across the investing community.
- The mathematics may be daunting for some investors.
The authors provide a program for others to try.
For related research, see “Measuring Investment Strategy Snooping Bias”, “Insidiousness of Overfitting Investment Strategies via Iterative Backtests” and “Taming the Factor Zoo?”.