What is the big picture on stock return predictors? In their May 2012 paper entitled “The Supraview of Return Predictive Signals”, Jeremiah Green, John Hand and Frank Zhang examine aggregate characteristics of 333 signals for which formal research indicates power to predict stock returns. They categorize each signal as accounting-based (from firm financial statements, such as accruals), finance-based (directly or indirectly from stock prices, such as return momentum) or other-based (such as stock buybacks). They standardize across studies via annualization by multiplying daily, weekly, monthly and quarterly returns by 250, 52, 12 and 4, respectively. They compile equal-weighted returns and value-weighted returns separately. They focus on Sharpe ratio as a widely used metric for comparing investment performance. Using a database of predictive signals as published in top-tier U.S. accounting, finance and practitioner journals and as disseminated in academic working papers via the Social Science Research Network (SSRN) during 1970 through 2010, they conclude that:
- Of 333 predictive signals found, 147 are accounting-based, 106 are finance-based and the rest are other-based, with the number of discoveries growing exponentially over time. Practitioners (usually as coauthors) account for just 7% of signal discoveries.
- The hedge portfolio method of measuring predictive value (long and short extreme deciles of signal strength) has largely displaced event study and regression approaches over the past 20 years.
- Of 239 (98) signals measured with equal-weighted (value-weighted) returns, the average annualized gross return, standard deviation of annualized returns and annualized gross Sharpe ratio are 12.2%, 12.1% and 1.04 (8.1%, 12.2% and 0.70), respectively. The comparable average annualized return and Sharpe ratio for the equal-weighted (value-weighted) U.S. stock market are 9.5% and 0.50 (6.6% and 0.44).
- Average gross returns, standard deviations of returns and gross Sharpe ratios of accounting-based signals are very similar to those of finance-based signals, with both generally outperforming other-based signals.
- Average gross returns and gross Sharpe ratios generated by famous signals such as accruals and momentum are below the median of all signals.
- The average performance of newly discovered signals is consistent over time. In other words, signals discovered in the 2000s have statistics similar to those discovered in the 1990s, 1980s or 1970s.
- Signals with high average gross returns tend to have relatively large standard deviations of returns, but they also generally offer high gross Sharpe ratios.
- 88% of studies measure independence of new signals relative to no more than those associated with the popular four-factor (market, size, book-to-market ratio, momentum) model of stock returns.
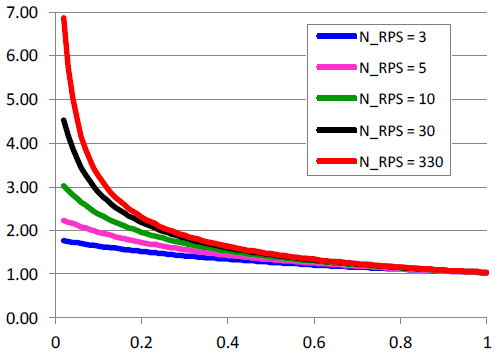
- If the average pairwise correlation among gross return streams of signals is on the order of 0.10 or less, the gross Sharpe ratio of a portfolio constructed from multiple signals can exceed 3.0 (see the chart below).
- In fact, the average pairwise correlation based on gross return streams for equal-weighted (value-weighted) hedge portfolios generated by a subsample of 33 signals for which reasonably complete data is available during 1981 through 2010 is only 0.06 (0.07). The average absolute pairwise correlation is less than 0.25, so the probability that a given signal with a significantly positive gross hedge return has a reliably positive gross alpha after accounting for the four-factor model and five other randomly chosen signals is about 65%. This result suggests that investors can improve their investment strategies by hunting for new sources of alpha.
The following chart, taken from the paper, summarizes the behavior of gross Sharpe ratio for a portfolio diversified (equally) across multiple hedge portfolios (each equal-weighted) generated by different return-predictive signals (RPS) as a function of: (1) average pairwise correlation of gross signal return streams; and, (2) number of signals included in the portfolio. Sharpe ratio increases with the number of signals included, but at a decreasing rate. Sharpe ratio increases as average pairwise correlation decreases, at an increasing rate.
As noted above, the average pairwise correlation of gross return streams for a subsample of 33 signals is 0.06, suggesting considerable opportunity to boost Sharpe ratio by diversifying across signals.
However, the combined effects of such supra-portfolio construction on position size and turnover may drive considerable trading frictions.

In summary, evidence from the body of research on signals predictive of gross stock returns suggests strong potential to achieve high risk-adjusted, gross performance by hunting for new signals and diversifying across them.
Cautions regarding findings include:
- Use of different methodologies, assumptions and sample periods confounds comparison of predictive signal returns.
- As emphasized, returns described in the paper are gross, as is often the case in academic studies. Incorporating reasonable trading frictions would reduce these returns. Moreover, because trading frictions may vary considerably across signal portfolios, incorporating them may affect signal performance ranking. Also, trading frictions vary over time (see “Trading Frictions Over the Long Run”), so impacts on net outcome vary with the sample period.
- Many academic studies involving long-short hedge portfolios do not verify feasibility of shorting or include stock borrowing costs. This concern is strongest for signals generating profit mostly from the short side of their portfolios.
- Many academic studies use statistical significance tests that assume tame return distributions. To the extent that actual return distributions are not tame, the meaningfulness of predictive statistics deteriorates.
- The paper does not address whether signal strength attenuates over time after discovery. Such attenuation may degrade exploitability. See, for example, “Liquidity Eroding Anomalies?”
- The paper does not address data snooping bias derived from testing multiple strategies on the same (or overlapping) samples. The more strategies tested, the greater the luck incorporated in the best strategies. Failed tests generally go unpublished, so the number of attempts to find significant predictors (and therefore the bias in results for published predictors) is unknown.
- The paper essentially addresses only one asset class, U.S. stocks.