Is it misleading to view factor risk premiums (such as for market, size and value) as constant over time? In his June 2015 paper entitled “Dynamic Risk Premia and Asset Pricing Puzzles”, Andy Jia-Yuh Yeh generates time-varying (dynamic) risk premiums for the Fama-French five-factor asset pricing model and explores whether widely accepted asset pricing anomalies exist after accounting for premium dynamics. Specifically, he applies a filter “trained” by rolling 60-month histories of risk factor returns to generate time-varying series for the market, size, book-to-market, profitability and investment risk factor premiums. He then tests whether widely accepted size, value, momentum, investment, profitability, short-term reversal and long-term reversion stock return anomalies remain statistically significant after accounting for premium time variation. Using monthly returns for U.S. stock factor portfolios from Kenneth French’s library spanning January 1964 through December 2013, he finds that:
- After accounting for risk factor premium dynamics, the size, value, momentum, investment, profitability, short-term reversal and long-term reversion alphas are not reliably non-zero. Said differently, anomaly alphas are too volatile to confirm reliable outperformance of associated portfolio tilts (see the chart below).
- In other words, the collective wisdom of the five Fama-French factors, calculated dynamically, explains nearly all of the time variation in excess returns for various stock rankings.
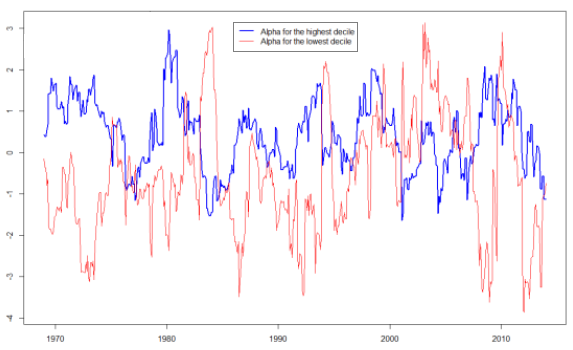
The following chart, taken from the appendix to the paper, shows the time series of the alphas for the value-weighted extreme tenths (deciles) of stocks ranked by momentum (past 11-month returns, with a skip-month before portfolio formation) based the dynamic five-factor model of stock returns. The blue (red) line tracks the alpha for the top (bottom) decile. The difference represents the momentum anomaly, which exhibits high variability, often switching signs. This high variability confounds confidence that the average alpha spread is not zero.
Other charts in the appendix cover size, value, profitability, investment, short-term reversal and long-term reversion alphas based on the dynamic five-factor model.
In summary, evidence supports belief that a dynamic five-factor model of stock returns more accurately reflects reality than a static model, and that the alphas generated by this model for widely accepted anomalies are so noisy that they lose statistical significance.
In other words, investors should be cautious about extracting practical wisdom from academic research that embeds simplifying assumptions to make analysis of real data tractable.
Cautions regarding findings include:
- Analyses embrace complexity and are therefore complicated to apply.
- As with factor/anomaly analyses in general, performance calculations ignore portfolio formation frictions. Accounting for monthly portfolio reformation costs would lower returns and could affect findings.
- Analyses invoke an arbitrary 60-month look-back interval to measure dynamics (filter training). Findings may not be robust to other lengths for this interval.