Why does the conventional wisdom on the predictability of stock market returns morph (no, yes, maybe, probably not) over time? In their July 2008 paper entitled “Time-Varying Short-Horizon Return Predictability”, Sam James Henkel, Spencer Martin and Federico Nardari apply a regime-switching vector autoregression (RSVAR) framework to explore and explain the degree to which the predictability of equity market returns at a one-month forecast horizon changes over time. They focus on the following four potential predictors: dividend yield, short-term interest rate, interest rate term spread and default spread between high-grade and low-grade corporate bonds. Using monthly stock market returns and contemporaneous economic data for the G7 countries (Canada, France, Germany, Italy, Japan, UK and U.S.) as available through 2007, they conclude that:
- The near-term predictive power of the four tested predictors is nonexistent during business cycle expansions but sizable during business cycle contractions. For example, over the period 1953-2007, the adjusted R-squared statistic for the relationship between next-month U.S. stock market returns and current combined predictor values is less than 0.01 during expansions but about 0.18 during recessions.
- Similar results hold for all G7 countries, but in three cases the difference in predictive powers between recessions and expansions is marginal.
- In none of the countries is a predictor significant during expansions but not during recessions.
- The adjusted R-squared does not significantly differ from zero during expansions in any country.
- The seven-country average adjusted R-squared is 0.02 during expansions and 0.15 during recessions.
- The periods of significant predictive power occur during intervals of high stock market volatility, so the predictability may be of little use to risk-averse investors.
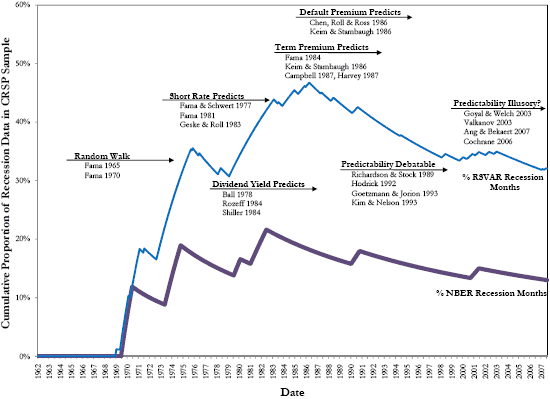
- Findings from prior stock market predictability studies are limited by availability of stock market return data and influenced by the parallel economic history (see the chart below).
The following chart, taken from the paper, shows the cumulative proportion of NBER recession months and RSVAR-calculated recession months to the total months of data available from the Center for Research in Security Prices (CRSP) during 1962-2007. Overlayed notations characterize research findings on the predictive power of the four predictors over this period, as follows: (1) the random walk model of stock prices (no predictability) dominated the 1970s after the persistently expansionary 1960s; (2) predictability emerged in 1980s research following multiple recessions; and, (3) skepticism of predictability grew in the 1990s following the expansions of the 1980s and 1990s.

In summary, the ability of commonly used indicators to predict near-term (one-month) stock market returns appears during economic recessions (periods of high return volatility) but vanishes during economic expansions.