Do factor models predict returns for corporate bonds as they do for stocks? In their October 2014 paper entitled “Factor Investing in the Corporate Bond Market”, Patrick Houweling and Jeroen van Zundert develop and test a four-factor (size, low-risk, value and momentum) model of future corporate bond returns. Each month for investment grade and high yield bond market segments separately, they construct an equally-weighted long-only portfolio consisting of the 10% of bonds with the highest exposure to each factor. They hold portfolios for 12 months, resulting in 12 overlapping portfolios for each segment and factor. Specifically, the factor portfolios are:
- Size – the 10% of bonds with the smallest company index weights, calculated as the sum of market value weights of all company bonds in the index that month.
- Low-risk – a combination of rating and maturity. For investment grade, the portfolio holds the 10% of bonds rated AAA to A- and having the shortest maturities. For high yield, the portfolio holds the 10% of bonds rated BB+ to B- and having the shortest maturities. On average, the maturity threshold is 2.8 (3.7) years for investment grade (high yield).
- Value – the 10% of bonds with the largest percentage gaps between actual credit spread and credit spread indicated by monthly regressions of credit spread on rating.
- Momentum – the 10% of bonds with the highest return relative to duration-matched U.S. Treasuries from six months ago to one month ago (with a skip-month to avoid reversal).
They evaluate factor portfolio performance based on excess return of constituent corporate bonds versus duration-matched U.S. Treasuries (thereby focusing on the default premium component of corporate bond returns). To estimate trading frictions, they model bid-ask spreads based on maturity and rating (the longer maturity or the lower the rating, the larger the estimated trading friction). Portfolio-level trading frictions are sums of frictions for all bonds traded. Using monthly data for all bonds in the Barclays U.S. Corporate Investment Grade index and the Barclays U.S. Corporate High Yield index during January 1994 through December 2013 (about 800,000 investment grade and 300,000 high yield bond-month observations), they find that:
- Benchmark gross annual market excess returns (default premiums) are 0.59% for investment grade and 2.46% for high yield. The corresponding gross annual Sharpe ratios are 0.13 and 0.24.
- Magnitudes of individual factor premiums are substantial, as large as four times the corresponding benchmark over the long term. Specifically:
- Factor portfolios for investment grade (high yield) bonds outperforms the benchmark with average gross annual returns of 1.34% (6.48%) for size, 0.96% (3.91%) for low-risk, 2.51% (7.85%) for value and 0.96% (4.63%) for momentum.
- Corresponding gross annual Sharpe ratios are 0.32 (0.57) for size, 0.42 (0.57) for low-risk, 0.31 (0.45) for value and 0.22 (44) for momentum.
- Nonetheless, investors may view the factor portfolios as risky due to their fairly large tracking errors (volatility of outperformance).
- Pairwise correlations of factor portfolio outperformances relative to the market are all 0.51 or lower, indicating that the factors capture different effects and are mutually diversifying. The investment grade (high yield) multi-factor portfolio has a gross annual Sharpe ratio of 0.33 (0.52), with tracking errors lower than those of single factor portfolios.
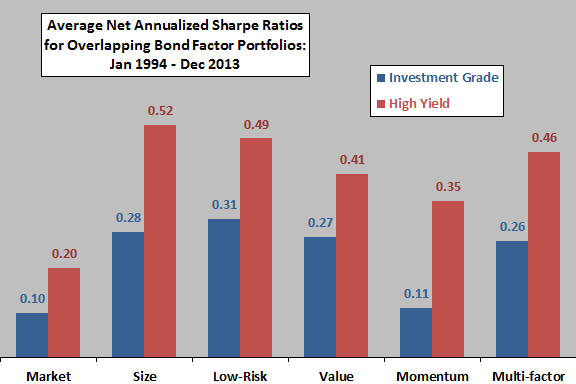
- Results survive estimated transaction costs (see the chart below).
- Results are robust to alternative factor definitions and the portfolio construction rules.
- Investors holding a stocks-bonds portfolio who already apply factor investing to stocks can boost annual alpha by about 1% and annual Sharpe ratio by about 0.1 by also applying factors to bonds.
The following chart, constructed from data in the paper, summarizes average net annual Sharpe ratios for the market benchmark (default premium) portfolio, size factor portfolio, low-risk factor portfolio, value factor portfolio, momentum factor portfolio and a multi-factor portfolio for U.S. investment grade and U.S. high yield corporate bonds over the sample period. Results indicate that factor portfolios generally outperform the market benchmark by substantial margins.
In summary, evidence indicates that investment grade and high yield corporate bond portfolios constructed based on size, low-risk, value and momentum factors outperform the corresponding segments of the U.S. corporate bond market.
Cautions regarding findings include:
- Assembling and maintaining a portfolio of individual corporate bonds is problematic for many investors, and delegating to a portfolio manager incurs fees. The authors note that: “At the moment investors do not have many investment vehicles available to harvest factor premiums in the corporate bond market.” But they add: “we expect this to change in the near future in the corporate bond market…” Such vehicles will bear management fees that debit factor returns.
- The sample period is predominately disinflationary and bullish for bonds. Results during a bearish inflationary trend may differ (such that even outperforming bonds may be unattractive).