Do shareholders realize the full benefits of open market stock buybacks, or are corporate executives increasingly gaming accounting rules and stock buybacks to maximize the value of management stock options? In their December 2008 paper entitled “Accounting Rules? Stock Buybacks and Stock Options: Additional Evidence”, Paul Griffin and Ning Zhu investigate how stock option compensation influences whether, how much and when companies distribute funds as open market stock buybacks rather than dividends. Using data for fiscal years 2005 through 2007 of U.S. public companies, they conclude that:
- U.S. public companies spent over $1 trillion on open market stock buybacks in 2007, more than total dividends paid and nearly two-thirds of net income. Since 2000, total corporate spending on stock buybacks is nearly $4 trillion.
- Both the likelihood that a company chooses a buyback over a dividend and the size of buyback increase as:
- The total number of exercisable stock options held by management increases.
- The number of exercisable stock options held by the CEO increases.
- Stock option grant price decreases (option value increases).
- CEO compensation increases.
- Indicators of strong corporate governance decrease.
- Buybacks and exercises of stock options by management (and by CEOs in particular) tend to coincide, supporting a perception that they represent a coordinated effort to enhance management compensation.
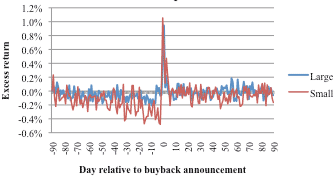
- While investors still tend to respond positively to buyback announcements (an average three-day excess return of 1.78%, lower than in previous studies), the presence of higher management stock option values and higher CEO compensation moderates investor response. (See the first chart below.)
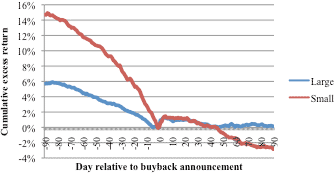
- There is a reliably negative return from 90 days before to 90 days after buyback announcements. (See the second chart below.)
The following charts, taken from the paper, show the daily and cumulative excess returns (relative to the market) for large and small companies announcing open market stock buybacks from from 90 days before to 90 days after announcement. The charts show that buyback stocks tend to underperform in the three months before the buyback announcement, outperform modestly for a few days after announcement (an average three-day excess return of 1.78%) and then either match overall market performance (large stocks) or underperform the market (small stocks) in the weeks after the announcement bump. Buyback effects are generally stronger for small stocks than large ones. Stock trading volume (not shown) spikes on the announcement date, but starts increasing several days before the announcement.


In summary, evidence for the management compensation (rather than reward for shareholders) motivation for open market stock buybacks is mounting, causing investors to pay less attention to buybacks.