A reader commented and asked: “Ned Davis Research calculates a time cycle composite. How good is an equal weighting of the annual seasonal cycle, the Presidential term cycle and the decennial cycle at predicting the direction of the market?” To check, we forecast return for a given month by averaging: (1) the average return for the calendar month up through the previous year; (2) the average monthly return for the Presidential term year up through the previous Presidential term; and, (3) the average monthly return for the year of a decade up through the previous decade. Using monthly levels of the Dow Jones Industrial Average (DJIA) since October 1928, the S&P 500 Index since January 1950 and Shiller’s S&P Composite Index since January 1871, all through December 2016, we find that:
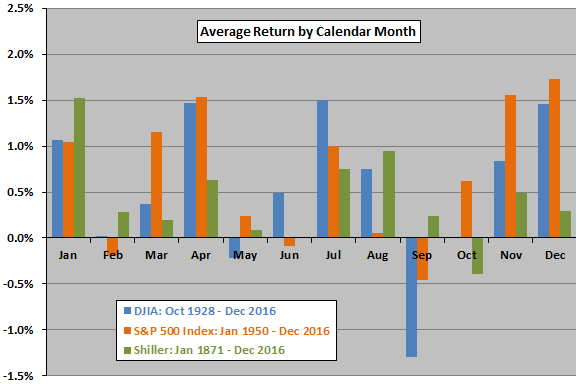
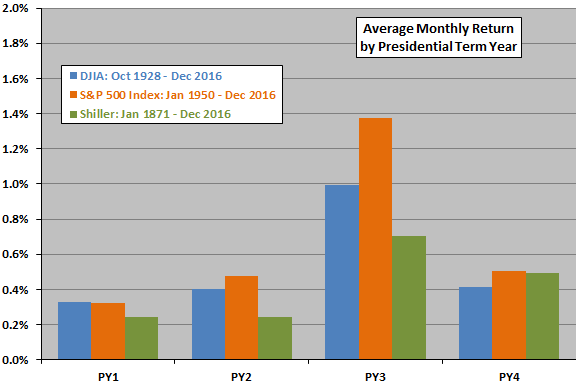
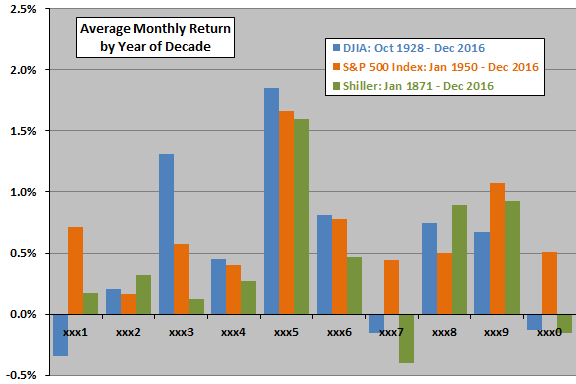
The following charts summarize average return by calendar month, average monthly return by Presidential term year and average monthly return by year of the decade for all three datasets. Results across the three samples for calendar year and decade decompositions are not remarkably alike, undermining belief in recurring cycles at annual and decade frequencies. Note that:
- Average monthly returns for the entire samples are 0.55%, 0.70% and 0.44% respectively for the DJIA, the S&P 500 Index and the S&P Composite Index, indicating that market returns may vary considerably over long periods.
- Samples are small for inferring a Presidential term cycle, consisting of only 22, 17 and 36 Presidential terms. The underlying political process offers some non-empirical basis for belief in this cycle.
- Samples are extremely small for inferring a decennial cycle, consisting of only about 9, 7 and 14 decades. Given the variability in the data, these samples are too small to support reliable inference.
Assuming nevertheless that annual seasonal, Presidential term and decennial cycles exist, we proceed using DJIA data as a compromise between sample length and modernity, keeping in mind that an investor operating in real time could know only averages to date. In other words, data used for forecasting should not include any future actual returns.
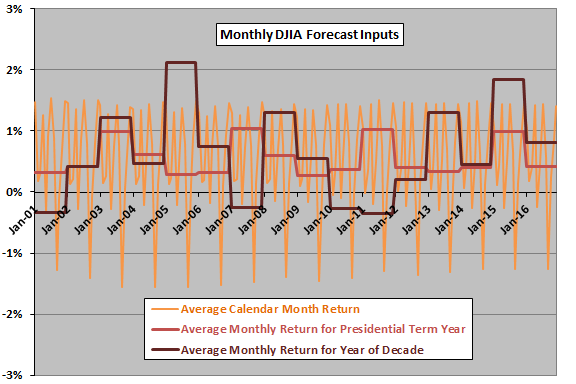
To test 3-cycle predictive power, we apply the forecasting method specified above to predict DJIA returns by month for January 2001 through December 2016 (192 forecasted months based on at least 867 months of historical data). Forecast granularity must be monthly to exploit an annual seasonal (calendar month) input. For example, to forecast the return for January 2001, we take an average of: (1) average return for January through 2000; (2) average monthly return for Presidential term year one up through 1997; and, (3) average monthly return for the first year of a decade up through 1991. For subsequent months and years, we extend historical data to incorporate additional actual returns as realized.
The next chart shows the three DJIA forecast inputs to be averaged for January 2001 through December 2016. Peaks (Valleys) in calendar month inputs are for December-January (September). Peaks in Presidential term year inputs are for year three. Peaks by year of decade are for xxx5. Next, we average the three inputs to calculate a 3-cycle monthly forecast.
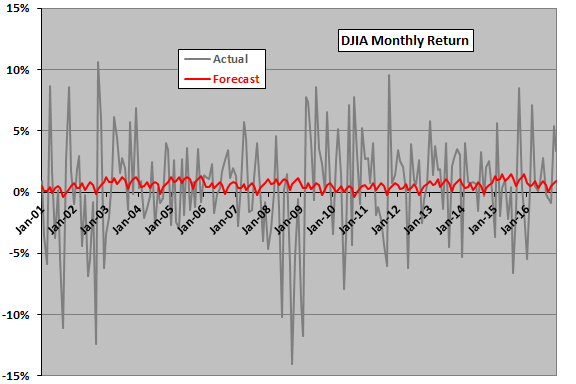
The next chart compares the monthly 3-cycle DJIA forecasted returns for January 2001 through December 2016 to actual DJIA returns. The average forecasted and actual monthly returns are 0.58% and 0.40%, respectively (the 2000s have an historically very low average monthly return). The usefulness of relative highs and lows of the forecast series is not clear from visual inspection.
Unsurprisingly, actual returns are far more volatile than forecasts calculated with averages (respective standard deviations 4.09% and 0.38%). The 3-cycle forecasted return is negative for 14 of 192 months. During those 14 months, the actual return is positive seven times and negative seven times. The 3-cycle forecasted return is positive for 178 of 192 months. During those 178 months, the actual return is positive 107 times and negative 71 times.
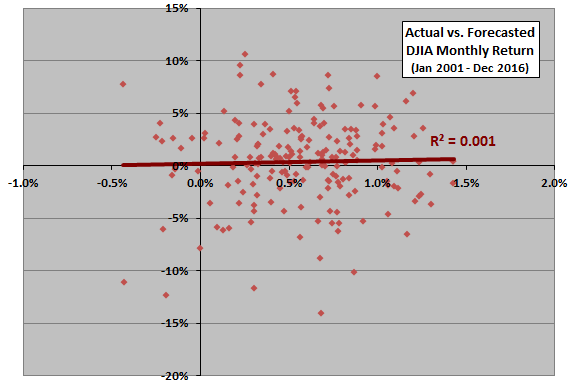
For precision in measuring forecasting power, we recast the data as a scatter plot.
The following scatter plot relates actual to forecasted DJIA monthly returns for January 2001 through December 2012. The Pearson correlation for the relationship is 0.03 and the R-squared statistic 0.001, indicating that forecasts explain practically none of the variation in actual results. In other words, the 3-cycle combination is not usefully predictive since the beginning of 2001.
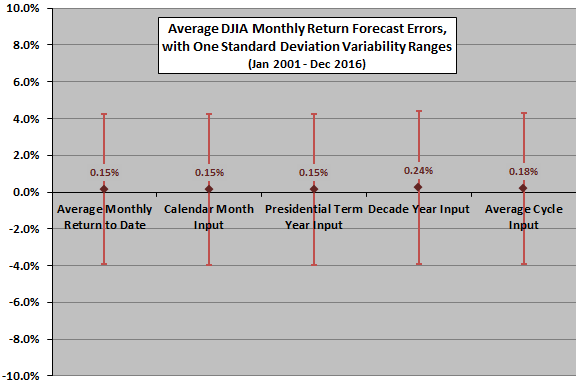
How does accuracy of the 3-cycle forecast compare with those of average monthly return to date and the separate cycle inputs?
The final chart summarizes average monthly forecast errors and standard deviations of monthly forecast errors for five monthly DJIA return forecasting methods:
- Average monthly return to date (all past months).
- Average monthly return to date for the given calendar month (3-cycle input one).
- Average monthly return to date for the given Presidential term year (3-cycle input two).
- Average monthly return to date for the given year of the decade (3-cycle input three).
- Average 3-cycle monthly forecasted return as specified above.
Results indicate that the average monthly return to date is as good as or better than all individual cycle forecasts and the 3-cycle forecast. R-squared statistics for regressions of actual returns versus the five forecast series are, in order, 0.008, 0.005, 0.000, 0.001 and (as above) 0.001. In other words, none of the methods appear to have useful predictive power out-of-sample.
In summary, evidence from simple tests of a forecast that straightforwardly combines calendar month, Presidential term and decennial cycles in stock market behavior does not support belief that these inputs usefully predict stock market returns.
Cautions regarding findings include:
- Other datasets or other methods of combining the three inputs may produce different results.
- As noted, samples are small for analysis of the Presidential term and (especially) decennial cycles.
- The Shiller data uses the average daily close during a month rather than monthly close, thereby introducing some differences in cycle indications (likely dampening monthly differences).