Are some calendar months more likely to exhibit stock market continuation or reversal than others, perhaps due to seasonal or fund reporting effects? In other words, is intrinsic (times series or absolute) momentum an artifact of some months or all months? To investigate, we relate U.S. stock index returns for each calendar month to those for the preceding 3, 6 and 12 months. Using monthly closes of the S&P 500 Index since December 1927 and the Russell 2000 Index since September 1987, both through January 2020, we find that:
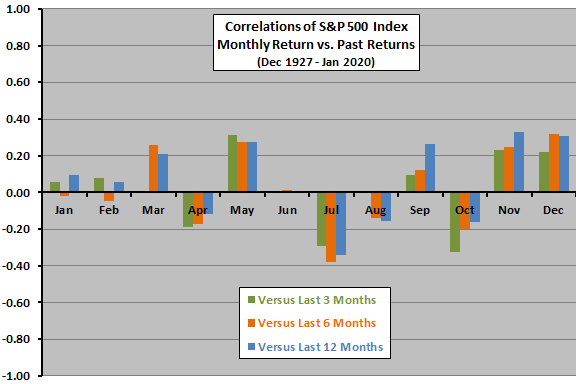
The following chart summarizes correlations between S&P 500 Index monthly returns and returns over the preceding 3, 6 and 12 months over the available sample period. Results are reasonably consistent for the three look-back intervals, suggesting that May, September, November and December tend to be trend continuation months and that April, July and October tend to be trend reversal months. Trend reversals in April and October somewhat agree with seasonal (November through April, and May through October) changes.
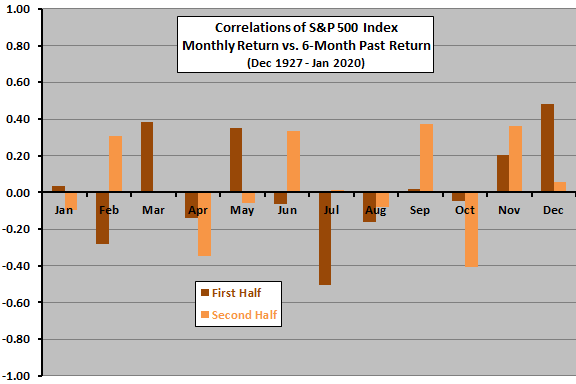
As a robustness test, we look at two equal subperiods for the 6-month look-back interval.

The next chart summarizes correlations between S&P 500 Index monthly returns and returns over the preceding 6 months for two equal subperiods, with break point in mid-1973. There is considerable disagreement between subsamples, undermining belief in any reliable findings. Said differently, an investor using findings from the first half of the sample would have fared poorly applying findings to the second half.
As an additional robustness test, we test 3-month, 6-month and 12-month look-back intervals for the Russell 2000 Index since its inception.

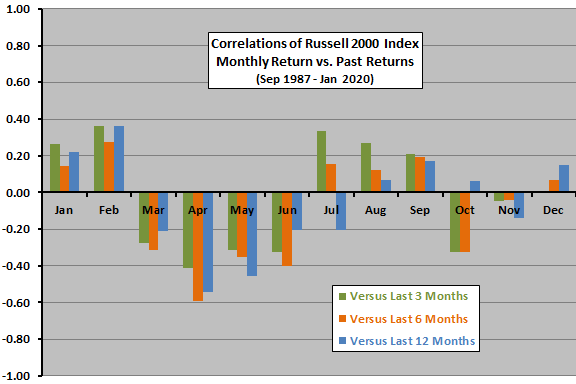
The next chart summarizes correlations between Russell 2000 Index monthly returns and returns over the preceding 3, 6 and 12 months over the available sample period. Results are mostly consistent for the three look-back intervals, suggesting that January, February, August and September tend to be trend continuation months and that March, April, May and June tend to be trend reversal months.
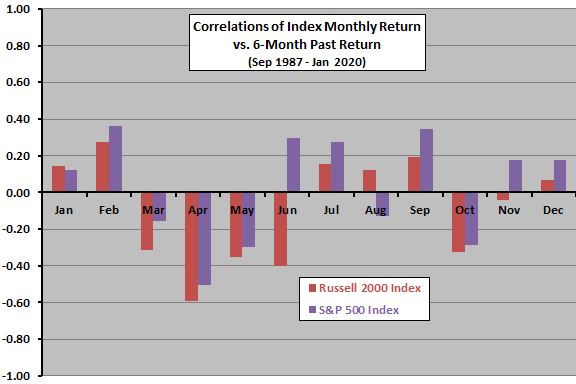
Results for the Russell 2000 Index are different from those for the S&P 500 Index over a longer sample period. Differences are most pronounced for March, May, June and November, suggesting different behaviors for different asset classes or instability over time. To disentangle, we compare behaviors of both indexes for the 6-month look-back over the Russell 200 Index sample period.

The final chart summarizes correlations between monthly returns and returns over the preceding 6 months for both the Russell 2000 Index and the S&P 500 Index over the life of the former. Results suggest that both explanations, difference in asset classes and instability over time, apply. The most notable difference is for June.

In summary, evidence from simple tests on U.S. stock indexes offers little support for belief that some calendar months may be more prone to continuation or reversal of trends than others.
Cautions regarding findings include:
- S&P 500 Index subperiods and the Russell 2000 Index sample periods are modest relative to the longest look-back interval.
- Analyses are in-sample. As noted, instabilities across subsamples indicate that an investor operating in real time would have very different beliefs about continuation and reversal months at different times.
For a different perspective, see the Trading Calendar.