Is the outperformance of stocks during November-April compared to May-October pervasive worldwide and over time? In their October 2012 paper entitled “The Halloween Effect: Everywhere and All the Time”, Ben Jacobsen and Cherry Zhang test the “Halloween” or “Sell-in-May” effect for all stock markets worldwide using the full histories of indexes available for these markets (excluding dividends). Using 55,425 monthly observations for 108 stock market indexes (24 developed, 21 emerging, 31 frontier and 32 rarely studied) during 1693 through 2011 (319 years), they find that:
- For data pooled across all indexes, the average difference between November-April and May-October returns is:
- 4.52% (statistically strong) over the entire sample period.
- Positive during 24 of 31 ten-year subperiods.
- Increasing over time in both size and statistical significance, peaking during 1991-2000 and averaging 6.3% over the past 50 years.
- By country and type of market:
- The average difference between November-April and May-October returns is positive for 81 of 108 country indexes, significantly so for 35 indexes (and significantly negative for only two indexes).
- The Halloween effect is more prevalent in developed and emerging markets than in frontier and rarely studied markets.
- Correspondingly, it is most prevalent in Europe, North America and Asia. Japan exhibits the largest Halloween effect, with average difference between November-April and May-October returns 8.3%.
- For 37 countries covered in prior research, a strategy that is in the stock index (U.S. Treasury bills) during November-April (May-October) over the post-publication subperiod of October 1998 through April 2011:
- Beats buying and holding the index (buy-and-hold) based on gross capital gain in 31 of 37 countries.
- Beats buy-and-hold based on gross risk-adjusted capital gain in 36 of 37 countries.
- For the longest country sample (UK), a trading strategy that is in the stock index (risk-free asset) during November-April (May-October) beats buy-and-hold on a gross basis:
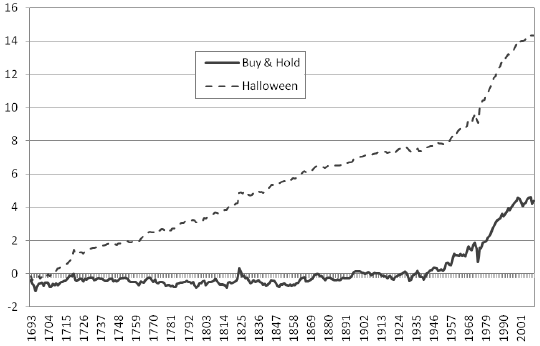
- By a factor of about three over the entire sample period (see the chart below).
- For all non-overlapping 100-year and 50-year subperiods.
- For nine of ten non-overlapping 30-year subperiods (the exception is 1941-1970).
- For 92% (82%) of non-overlapping ten-year (five-year) subperiods.
- For 63% (200/317) of years.
The following chart, taken from the paper, compares cumulative capital gains of buying and holding the UK stock index (Buy & Hold) and a strategy that holds the index during November-April and earns the risk-free rate during May-October over the period 1693 through 2011. The buy and hold strategy shows hardly any capital gain until 1950. The cumulative return of the Halloween strategy increases consistently over time, and at a faster rate since 1950.

In summary, evidence indicates that the Halloween effect is a significant equity market anomaly that strengthens in recent years.
Cautions regarding findings include:
- Indexes are not tradable. Including the costs (trading frictions and management fees) of constructing and maintaining funds tracking these indexes would reduce reported returns.
- The study ignores the trading frictions associated with semiannual index entry and exit. Accounting for these frictions, which may be substantial in some markets at some times, would further reduce reported returns for the Halloween effect timing strategy.
- Since the indexes exclude dividends, the Halloween effect trading strategy ignores the dividend advantage of buy-and-hold during May-October, thereby overstating the strategy’s outperformance.
- The Halloween effect may not apply to non-equity asset classes.