Do asset returns exhibit cyclic relative strength? In the December 2015 revision of their paper entitled “Return Seasonalities”, Matti Keloharju, Juhani Linnainmaa and Peter Nyberg examine 12-month relative strength cycles via a strategy that is each month long (short) assets with the highest (lowest) returns during the same calendar month over the past 20 years. They apply this strategy to individual U.S. stocks, factor and anomaly portfolios of U.S. stocks, industry portfolios of U.S. stocks, developed country stock indexes and commodity futures contract series. They also test a 5-day relative strength cycle across individual U.S. stocks. They perform ancillary tests to investigate sources and interactions of relative strength cycles. Using monthly and daily data for a broad sample of U.S. common stocks, industry portfolios and factor/anomaly portfolios mostly since July 1963 and monthly data for 24 commodity futures series and 15 country stock indexes since January 1970, all through December 2011, they find that:
- For U.S. common stocks:
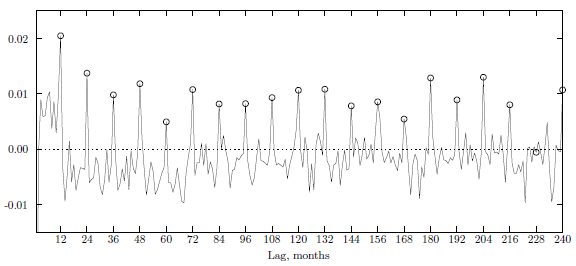
- Monthly return autoregressions aggregated across individual U.S. stocks exhibit positive 12-month cyclicality over 20 years (see the chart below).
- A strategy that is each month long (short) the value-weighted tenth of U.S. common stocks with the highest (lowest) returns during the same month over the past 20 years generates gross average monthly return 1.19%, compared to -0.96% based on other months.
- Monthly gross three-factor (market, size, book-to-market) alpha for this cyclicality is 1.22%.
- For portfolios of U.S. common stocks:
- A strategy that is each month long (short) the one of 10 portfolios sorted on size with the highest (lowest) returns during the same month over the past 20 years generates gross average monthly return 1.35%, compared to -0.94% based on other months.
- A strategy that is each month long (short) the one of 11 portfolios sorted on dividend-to-price ratio with the highest (lowest) returns during the same month over the past 20 years generates gross average monthly return 0.48%, compared to -0.50 based on other months.
- A strategy that is each month long (short) the two of 17 industry portfolios with the highest (lowest) returns during the same month over the past 20 years generates gross average monthly return 0.70%, compared to -0.81% based on other months.
- Portfolios sorted on book-to-market ratio, momentum and gross profitability exhibit little or no relative strength cyclicality. In fact, momentum and cyclic relative strength portfolios have similarities.
- Nevertheless, most anomalies do exhibit relative strength cyclicality. A strategy that is each month long (short) the three of 15 anomalies with the highest (lowest) returns during the same month over the past 20 years generates gross average monthly return 1.88%, compared to -0.36% based on other months.
- For developed market stock indexes and commodity futures contract series:
- A strategy that is each month long (short) the three country stock indexes with the highest (lowest) returns during the same month in the past generates gross average monthly return 0.48%, compared to -0.36% based on other months.
- A strategy that is each month long (short) the two or three commodity futures series with the highest (lowest) returns during the same month in the past generates gross average monthly return 0.93%, compared to -0.22% based on other months.
- Relative strength 12-month cycle strategies:
- Are not subsumed by the January effect.
- Are about equally strong whether investor sentiment is high and low.
- Resemble momentum in persistence, generally having significantly positive returns in all subperiods except the most recent 2003-2011 (during which it is still stronger than other anomalies).
- Tend to be volatile, because they remain exposed to the systematic risk that generates the cyclicality.
- Daily return autoregressions aggregated across individual U.S. stocks exhibit positive 5-day cyclicality. For example, a strategy that is each Monday long (short) the value-weighted tenth of U.S. common stocks with the highest (lowest) returns during Monday over the past 20 years generates gross average daily return 0.11%, compared to -0.05% based on other days of the week.
- Correlations between different relative strength cyclicality strategies are modest, suggesting multiple source factors and opportunities for diversification. For example:
- Monthly return correlation between the size and dividend-to-price ratio 12-month strategies is 0.17.
- Monthly return correlations between individual U.S. stock and country index (commodity futures) 12-month strategies is 0.02 (0.11).
- Monthly return correlation between individual U.S. stock 12-month and 5-day strategies is 0.05.
- Regarding in-sample optimal diversification:
- The gross annualized Sharpe ratio of the broad U.S. stock market is 0.46.
- Adding optimal size, book-to-market and momentum factor exposures boosts gross Sharpe ratio to 1.04.
- Further adding optimal exposure to the 12-month cycle for U.S. stocks boosts gross Sharpe ratio to 1.67, with the largest allocation to this new exposure (46%).
- Further adding optimal exposure to the 12-month cycle for country stock markets and commodity futures boosts gross Sharpe ratio to 1.74.
- Finally adding optimal exposure to the 5-day cycle for U.S. stocks boosts gross Sharpe ratio to 2.75, with dominant allocations to the 12-month cycle for U.S. stocks (21%) and the 5-day cycle for U.S. stocks (41%).
The following chart, taken from the paper, shows return autoregression coefficients aggregated across individual U.S. stocks over lags of 1 to 240 months (20 years) during January 1963 through December 2011. The chart shows:
- The conventional momentum effect for lags up through 12 months.
- The conventional reversion effect for lags greater than 12 months, except for…
- Recurring positive peaks at 12-month intervals across the range of lags.
This 12-month cycle of peaks underlies the 12-month relative strength cycle strategies described above.
In summary, evidence indicates that: (1) (gross) 12-month relative strength cycles are pervasive, persistent and largely uncorrelated across U.S. stocks, factor/anomaly/industry portfolios of U.S. stocks, developed market stock indexes and commodity futures contract series; and, (2) there is also a (gross) 5-day relative strength cycle across U.S. stocks.
Cautions regarding findings include:
- Reported relative strength cycle strategy returns do not account for monthly/weekly portfolio reformation frictions, which are high over much of the sample period. Specifically:
- Per the paper, “…the daily seasonality [5-day relative strength cycle] strategy is infeasible from an investment perspective due to its high trading costs…”
- Per the paper, “…monthly seasonality [12-month relative strength cycle] strategies are potentially feasible investment strategies, and it is instructive to compare them to short-term reversals as both strategies require almost 100% monthly turnover. …Moreover, even if investors do not trade seasonalities as separate strategies, they are substantial enough to influence investors’ decisions to enter and exit positions…”
- The strategy may tend to concentrate in less liquid (costly to trade) assets. Said differently, relative strength of assets based on net return may differ from relative strength based on gross return.
- Shorting costs/constraints would further reduce returns for relative strength cycle hedge portfolios. The strategy short side may tend to concentrate in assets costly/difficult to short.
- Moreover, stock indexes and factor/anomaly portfolios used in some tests are not funds. Liquid tracking funds would involve further frictions and fund manager fees.
- As noted, diversification Sharpe ratios are ideal (based on perfect foresight of returns).
See also the related “A 12-Month Cycle for Stock Returns?”.