Does the conventional wisdom of avoiding stocks during May through October work in recent years? In their July 2012 paper entitled “‘Sell in May and Go Away’ Just Won’t Go Away”, Sandro Andrade, Vidhi Chhaochharia and Michael Fuerst test the sell-in-May anomaly (or Halloween effect) based on data unambiguously available only after publication of the anomaly. They compute returns in adjacent six-month periods, the beginning of May to end of October and the beginning of November to end of April. They also test a trading strategy that: (1) from the end of April through the end of October, invests a fraction k (for k equals 3/4, 1/2, 1/3 and 0) of the portfolio in the stock market index and the balance in one-month Treasury bills (T-bills); and, (2) from the end of October through the end of April, invests 2-k in the stock market index by borrowing 1-k at the T-bill rate. Using total returns for 37 country stock market index and the MSCI World Index during during May 1970 through October 1998 (replicating prior research) and November 1998 through April 2012 (new data), along with contemporaneous T-bill yields for the latter, they find that:
- For November 1998 through April 2012, the average November-April gross return is larger than the average May-October gross return for all 37 country market indexes.
- Weighting country market indexes equally, the average November-April gross return is about 10% higher than the average May-October gross return for both the old and the new data sets. In other words, the anomaly has not weakened since publication. The anomaly for the MSCI World Index (value weighting 24 developed markets) is 2-3% weaker.
- All four variations of the above strategy that reduces (leverages) MSCI World Index exposure during May-October (November-April) generate higher average gross returns than buying and holding the index, with outperformance increasing as leverage increases (as k decreases). Standard deviations of timing strategy returns are comparable to that of buy-and-hold, such that annualized Sharpe ratios for all four timing strategy variations (ranging from 0.29 to 0.52 as leverage increases) are clearly superior to that of buy-and-hold (0.17).
- A similar analysis of total returns for bond indexes in 32 countries indicates no sell-in-May anomaly for bonds, especially for the new data.
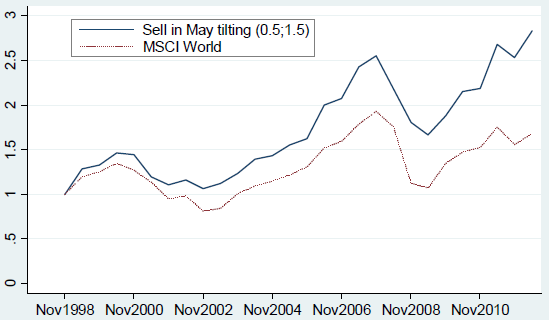
The following chart, taken from the paper, graphs wealth accumulation from passively holding the MSCI World Index and from the timing strategy described above with k equal to 1/2 during November 1998 through April 2012. The cumulative total return from the sell-in-May strategy during this period is nearly twice that for buy-and-hold.

In summary, evidence indicates that an exploitable sell-in-May anomaly persists across stock markets worldwide since publication.
Cautions regarding findings include:
- Reported returns are gross, not net. Including trading frictions for the active strategy (relatively small here since trading is only semiannual) would reduce these returns.
- Many investors may not be able to borrow funds for leverage during November through April at the T-bill rate. Higher borrowing costs could materially reduce active strategy performance.
- Calculating returns based on indexes rather than tradable funds (which include trading frictions for portfolio formation/maintenance and management fees) may overstate strategy outcomes.