Does the Sell-in-May/Halloween effect hold in recent data? In their April 2014 paper entitled “Sell in May and Go Away: Still Good Advice for Investors?”, Hubert Dichtl and Wolfgang Drobetz explore whether holding one of several stock indexes (cash) during November-April (May-October) beats buying and holding the index. They focus on sample periods since: (1) liquid index proxies are readily available for each index to both institutional and individual investors; and, (2) first publication in a top academic journal confirming the Halloween effect. They use both conventional regressions and bootstrap simulations. They consider six mostly total return indexes: S&P 500, DAX 30, FTSE 10, CAC 40, EuroStoxx 50 (not total return) and MSCI Emerging Markets (EM). They use a one-month interest rate for the return on cash. They apply a range of switching frictions to assess sensitivity of results to trading costs. Using monthly returns for the specified indexes from the first available January for each through December 2012 (so that they always work with full calendar years), they find that:
- For the maximum historical sample of all indexes (pre-dating total return versions), both regressions and bootstrap simulations confirm existence of the Halloween effect.
- Monthly returns for November-April are significantly higher than those for May-October.
- However, extreme months drive the effect in some cases.
- Based on bootstrap simulations since the availability of liquid proxies for the indexes, with switching frictions 0.5%, a Halloween strategy generates higher net annualized excess returns (Sharpe ratios) than buy-and-hold benchmarks in four (six) of six markets.
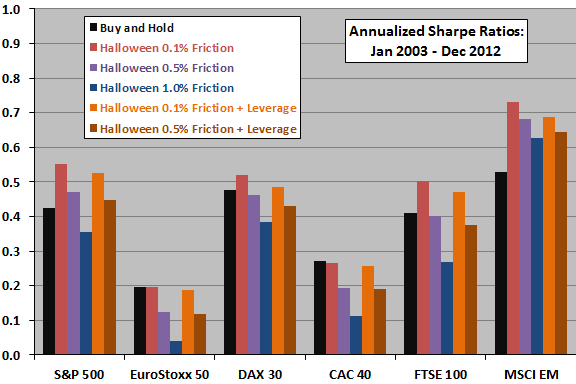
- Based on bootstrap simulations since first publication of the Halloween effect during January 2003 through December 2012 (see the chart below):
- For switching frictions 0.1%, a Halloween strategy generates higher net annualized excess returns (Sharpe ratios) than buy-and-hold benchmarks in zero (four) of six markets.
- For switching frictions 0.5%, a Halloween strategy generates higher net annualized excess returns (Sharpe ratios) than buy-and-hold benchmarks in zero (two) of six markets.
- For switching frictions 1.0%, a Halloween strategy generates higher net annualized excess returns (Sharpe ratios) than buy-and-hold benchmarks in zero (one) of six markets.
- For switching frictions 0.1% and free 2X leverage while in stocks during November-April, a Halloween strategy generates higher net annualized excess returns (Sharpe ratios) than buy-and-hold benchmarks in six (four) of six markets.
- For switching frictions 0.5% and free 2X leverage while in stocks during November-April, a Halloween strategy generates higher net annualized excess returns (Sharpe ratios) than buy-and-hold benchmarks in four (two) of six markets.
- Results are generally robust for different model specifications.
The following chart, constructed from data in the paper, summarizes net annualized Sharpe ratios across multiple total return indexes during the post-publication period of January 2003 through December 2012 for bootstrap simulations of the following Halloween strategy variations, indexes and benchmarks:
- Buy and Hold – buy and hold the index.
- Halloween 0.1% Friction – hold the index during November-April and cash at the short-term interest rate during May-October, with 0.1% index-cash switching friction.
- Halloween 0.5% Friction – same, except with 0.5% switching friction.
- Halloween 1.0% Friction – same, except with 1.0% switching friction.
- Halloween 0.5% Friction + Leverage – same as Halloween 0.5% Friction but with 2X leverage while in the index.
- Halloween 0.1% Friction + Leverage – same as Halloween 0.1% Friction but with 2X leverage while in the index.
Results suggest modest success for the Halloween strategy for low friction but no benefit from (free) leverage while in stocks.
In summary, evidence from the past decade offers little support for belief in the usefulness of simple Halloween effect strategies.
Cautions regarding findings include:
- The ten-year post-publication test is very short for evaluating an annual effect.
- The various equity indexes exhibit positive return correlations, limiting their value as independent tests.
- Simulation data modeling may lose some information in the time sequence of returns.
- Use of index returns ignores the costs of maintaining a liquid proxy, which would lower returns more for buy-and-hold than for the Halloween strategies.
- The authors apparently treat leverage as free. Broker interest charges for leverage would reduce performance of leveraged scenarios.