Are there reliable periodicities in U.S. stock returns tied to national election cycles? In their October 2008 paper entitled “Financial Astrology: Mapping the Presidential Election Cycle in US Stock Markets”, Wing-Keung Wong and Michael McAleer apply spectral analysis to identify and quantify cycles in U.S. stock market returns, including a presidential election cycle. Using weekly S&P 500 index data for the period 1965-2003, they conclude that:
- Over the sample period, stock prices tend to fall to a minimum during the second year of a Presidency and then rise to a peak in the third or fourth year.
- This cycle is stronger when the incumbent is a Republican.
- Bullish runs in the stock market tend to coincide with Democratic administrations.
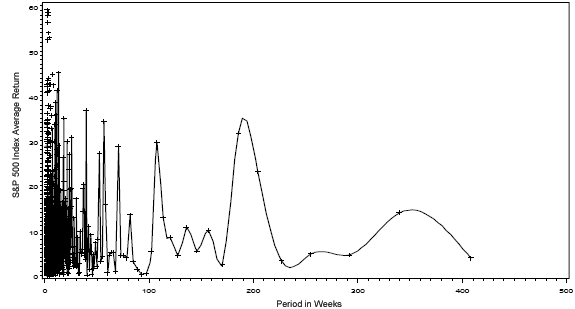
The following chart, taken from the paper, shows the results of a spectral analysis of U.S. stock market returns over the period 1965-2003. Spectral analysis smoothes some of the jaggedness and reveals cyclical peaks at about 200 weeks (3.8 years), 110 weeks (2.1 years) and several shorter periods.

In summary, spectral analysis confirms the probable existence of U.S. stock market cycles that coincide with election cycles.
The paper offers some interesting background regarding past research on stock market cyclicality, but seems to over-interpret the political meaning of results from a small sample.