Does intensity of firm quarterly earnings releases affect stock market behaviors? A reader proposed the following stock market timing strategy based on a strictly calendar-based definition of earnings season: go short (long) the market at the close at the end of the first full week (sixth full week) of each calendar quarter, representing the beginning (end) of earnings season. The hypothesis is that the broad stock market performs poorly during earnings season and well outside of earnings season. Using weekly closes for the S&P 500 Index since January 1950 and for the S&P 500 Implied Volatility Index (VIX) since January 1990, both through June 2014, we find that:
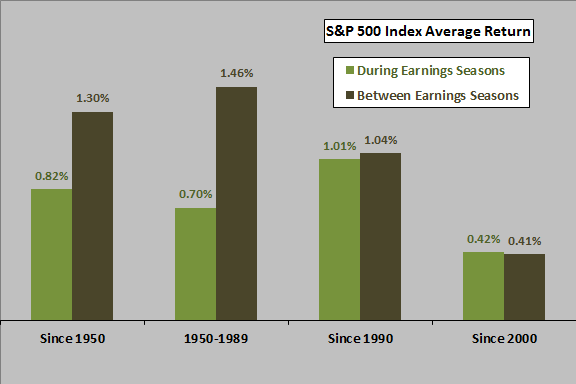
The following chart shows average returns for the S&P 500 Index during and between earnings seasons for four historical periods:
- Since 1950 (257 observations)
- During 1950-1989 (160 observations)
- Since 1990 (97 observations)
- Since 2000 (57 observations)
Periods between earnings seasons tend to generate greater returns than do earnings seasons. However, the early part of the sample period drives the overall difference. Results generally do not support shorting the market during earnings season.
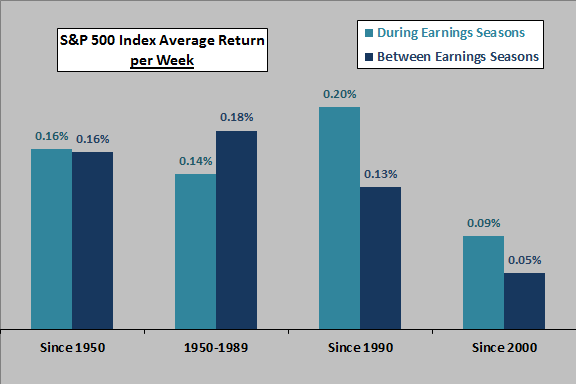
Since earnings seasons are on average about three weeks shorter than the intervals between earnings seasons, an interval comparison may mislead. What happens if we normalize based on average returns per week during and between earnings seasons?
The next chart shows the average normalized (per week) returns for the S&P 500 Index during and between earnings seasons for the same period and subperiods used above. There is no consistent difference in average stock market returns per week during and between earnings seasons. In recent subperiods, average returns are stronger during earnings season.
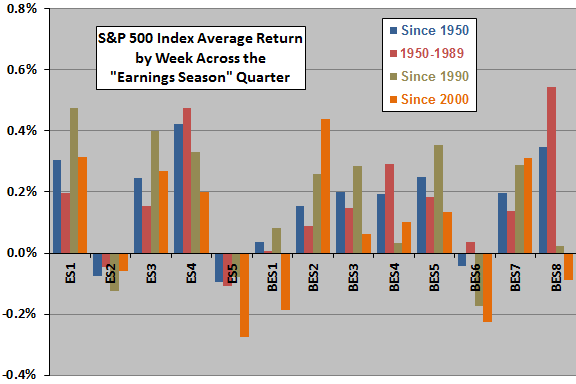
In case these aggregations miss some more granular pattern, we consider average returns by week across an earnings season-based quarter.
The next chart shows average returns for the S&P 500 Index by week during earnings seasons (weeks ES1 through ES5) and between earnings seasons (weeks BES1 through BES8) for the historical periods used above. There is some indication that the second and last weeks of earnings season and the first and sixth weeks between earnings seasons tend to be weak.
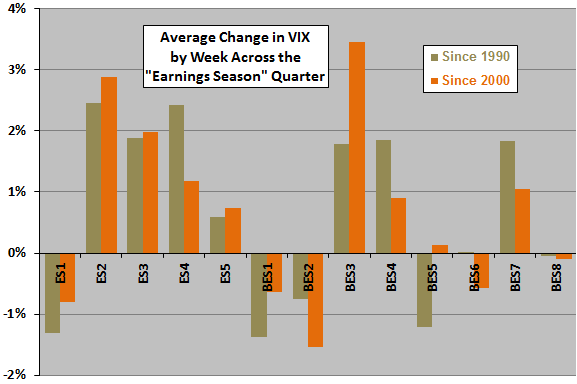
For a perspective on return volatility during and between earnings seasons, we look at weekly changes in VIX.
The final chart shows average changes in VIX by week during weeks ES1 through ES5 and weeks BES1 through BES8 since 1990 and since 2000. Results suggest that VIX tends to rise during most of earnings season and then fall after earnings season is over.
In summary, evidence from simple tests does not support a belief that the U.S. stock market is reliably weak (strong) during (between) earnings seasons.
Cautions regarding findings include:
- Recent subsamples are small in terms of secular market trends/conditions.
- Week-by-week results are particularly subject to data snooping bias (luck), such that results for extreme weeks likely overstate reasonable out-of-sample expectations.