Do naive investors, lured by news they encounter while the stock market is closed, bid up the prices of attention-getting stocks at the open? In their June 2010 paper entitled “Paying Attention: Overnight Returns and the Hidden Cost of Buying at the Open”, Henk Berkman, Paul Koch, Laura Tuttle and Ying Zhang examine whether attention-based trading by individual equity investors reliably causes temporary mispricing at the market open. Using intraday bid and ask price data for the 3,000 largest U.S. stocks over the period 1996-2008 (13 years), along with contemporaneous measures of retail investor attention to individual stocks and overall market sentiment, they conclude that:
- Returns across all stocks in the sample tend to advance overnight (0.1% per night) and reverse during the trading day (-0.07% per day).
- The overnight price bump derives mostly from high levels of retail buying at the open among stocks that have recently attracted the attention of individual investors. A subsample of stocks with high retail attention and low institutional ownership has an average overnight return (trading day reversal) in the range 0.2% to 0.3% (-0.2% to -0.4%). This attention effect tends to persist across days.
- The overnight price bump is pronounced for stocks that are difficult to value and costly to arbitrage (illiquid, high short interest). A subsample of such stocks has an average overnight return (trading day reversal) in the range 0.4% to 0.6% (-0.4% to -0.7%).
- Average overnight return and trading day reversal are more than twice as large during months with high versus low aggregate investor sentiment.
- The overnight/trading day pattern holds for all styles of stocks, is somewhat stronger on Mondays, and weakens following decimalization in 2001 and expansion of algorithmic trading in 2005.
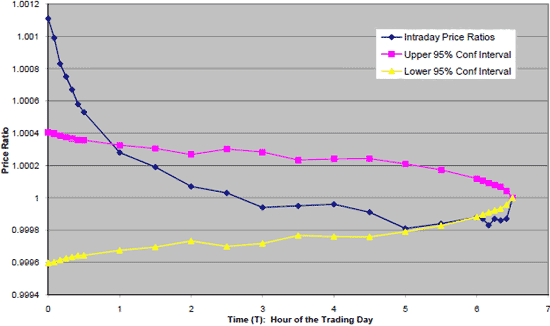
The following chart, taken from the paper, plots the average ratio of the midquote at various times during the trading day to the closing midquote for all stocks over the entire sample period. Measurements occur at 5-minute intervals over the first and last half hours of the trading day, and at 30-minute intervals over the rest of the trading day. The degree to which these Intraday Price Ratios fall outside the upper and lower 95% confidence intervals (constructed using the standard error of the time series mean across all days) indicates the statistical strength of the mispricing effect.
The chart shows that mispricing is statistically strong during about the first hour of the trading day.

In summary, evidence from a fairly large recent sample of U.S. stocks indicates that traders may be able to suppress trading friction by systematically executing sales at the open and buys later in the trading day.