Is it possible that some widely acknowledged calendar effects emerge from data only because of overlap with a few “real” calendar effects? In their December 2009 paper entitled “An Anatomy of Calendar Effects”, Stefan Grimbacher, Laurens Swinkels and Pim Van Vliet examine interactions among five calendar effects: Halloween, January, turn-of-the-month, weekend and holiday. Specifically, they employ tests that control for all five effects simultaneously to determine whether any dominate or disappear in isolation. Using daily returns for the U.S. stock market in excess of the 30-day Treasury bill yield over the period July 1963 through December 2008, they conclude that:
Definitions used for the five effects are:
- Halloween effect: November 1 – April 30
- January effect: January 1 – January 31
- Turn-of-the-month effect: last trading day of a month through fourth trading day of following month
- Holiday effect: the single trading day before either New Year’s Day, Presidents’ Day, Good Friday, Memorial Day, July Fourth, Labor Day, Thanksgiving or Christmas
- Weekend effect: Friday
Based on these definitions:
- About two thirds (one third) of all trading days involve at least one (none) of the five effects.
- On a standalone basis, all effects except (due to recent data) the January effect are economically and statistically significant.
- The Holiday effect is economically the strongest (43% annualized return).
- The turn-of-the-month effect is statistically the strongest.
- For most calendar effects, excess returns are positive across subperiods.
- On a joint basis, the Halloween and turn-of-the-month effects are strongest, effectively subsuming the other three.
- Days involving only the Halloween effect or the turn-of-the-month effect have strong returns.
- The weekend and holiday effects depend on overlap with the Halloween or turn-of-the-month effects.
- The annualized equity premium over the entire sample period is 7.2% for days covered by either the Halloween effect or the turn-of-the-month effect and -2.8% for all other days.
- Findings are robust across subperiods, an earlier 1926-1962 U.S. sample, equity styles and other stock markets.
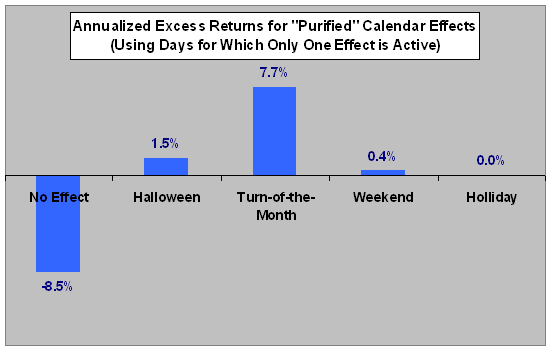
The following chart summarizes annualized excess returns for “purified” calendar effects, with purification accomplished by using days for which only one effect is active. Over the entire sample, 32.9% of trading days involve no calendar effect (No Effect),and 40.7% of the trading days involve just one effect. Of that 40.7%, purified frequencies for the Halloween, turn-of-the-month, weekend and holiday effects are 25.4%, 7.2%, 7.9% and 0.2%, respectively. The January effect does not exist in purified form, because it is always part of the Halloween effect. The remaining 26.4% of trading days not covered in the chart involve combinations of calendar effects. The paper provides data for combinations.

In summary, evidence from joint tests support a belief that the Halloween effect and the turn-of-the-month effect are the “real” calendar effects.
Tests of statistical significance in this paper assume that daily stock returns have a normal distribution.
The authors do not address strategies (and associated trading frictions) for exploiting calendar effects.