How well do calendar-based anomalies, such as the January and Halloween/Sell-in-May effects, hold up for data extending back three centuries? Do any new anomalies emerge from such a data set? In their October 2010 paper entitled “Are Monthly Seasonals Real? A Three Century Perspective”, Ben Jacobsen and Cherry Zhang examine an extremely long record of UK stock returns for evidence of calendar anomalies. Using 317 years of monthly UK stock index returns and risk-free rate proxies spanning 1693 through 2009, they find that:
- Most months exhibit 50-year subperiods of outperformance, demonstrating why researchers need extremely long data sets to neutralize sample noise, selection bias and data snooping bias.
- Average December, January, April and August returns are significantly higher than the returns for the rest of the year over the entire sample period, but no month significantly outperforms the market in all 50-year and 100-year subsamples.
- December comes close, underperforming only during the 1901-1950 subperiod.
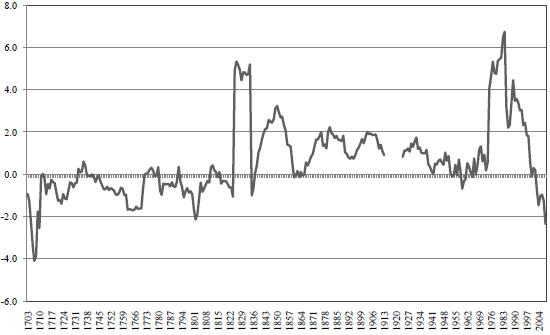
- The January effect emerges in the 1830s, when Christmas becomes a UK public holiday, apparently leaching performance from a previously dominant December. During the preceding 150 years, January underperforms (see the first chart below).
- October (July) underperforms the other months by an average 0.68% (0.46%) over the entire sample period. October and July also underperform consistently during all 50-year and 100-year subperiods. September underperforms and outperforms during 50-year subsamples and is not as bad as October.
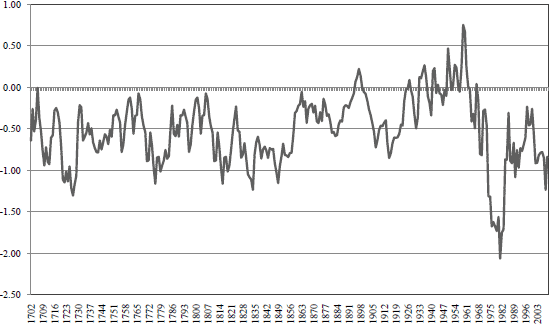
- November-April beats May-October (which, per the second chart below, actually underperforms the risk-free rate) by an average 0.56% over the entire sample period. This Halloween or Sell-in-May effect persists during all 50-year and 100-year subperiods. A Sell-in-May strategy beats the market more than 80% (90%) of the time over 5-year (10-year) horizons.
The following chart, taken from the paper, plots in percent the 10-year moving average of the difference between January returns and the average returns for the other 11 months across the entire sample period. It shows that the January effect emerged in the early 1800s, coincident with increased emphasis on the Christmas holiday. Before that time, January underperforms.

The next chart, also taken from the paper, plots in percent the May-October 10-year moving average return relative to the risk-free rate across the entire sample period. It shows that the the summer risk premium is negative over most of the past 300 years, and positive only during the 1930s to 1950s.
The persistence of this negative May-October premium and of the associated Halloween/Sell-in-May effect offers support for belief in a fundamental cause, such as Seasonal Affective Disorder.

In summary, evidence from an extremely long UK data set indicates that some calendar-based anomalies are persistent and others are not, suggesting a mix of biological, cultural and data snooping sources. The Halloween/Sell-in-May effect is among the most persistent.
Note that:
- The stock index used in this study consists of very few stocks in early subperiods, just three stocks for the first 110 years of the sample. There is generally a trade-off between sample duration and data quality/reliability.
- Calendar-based anomalies associated with public holidays suggest a cultural source, such that different cultures/countries would have different anomalies.