We previously found that Russell 2000 Index returns have tended to be negative during the interval from options expiration (OE) to the turn of the month (TOTM), strongly positive during TOTM and near zero from TOTM to OE. Might the index trend leading up to these segments, defined by the index being over or under a simple moving average (SMA), discriminate the strength of monthly segment effects? Are the results robust? Using daily opening and closing levels of the Russell 2000 index over the period September 1987 through April 2009 (259 complete months), we find that:
For the purpose of this analysis, we approximate:
- The OE level of the Russell 2000 Index is its value at the open on OE Friday.
- The level of the index at the beginning of TOTM is its value at the close on the fifth-to-last trading day of a calendar month.
- The level of the index at the end of TOTM is its value at the close on the fourth trading day of the next calendar month.
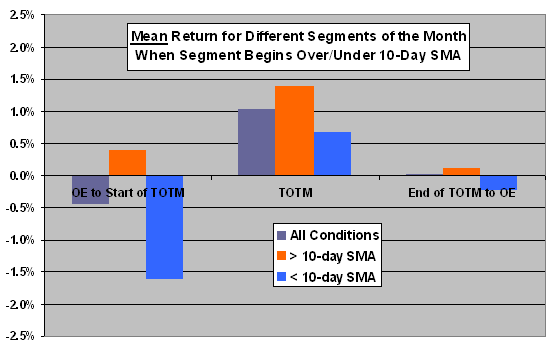
The following chart summarizes the mean monthly raw returns over the entire sample period for the following segments of the month:
- The interval from OE to the beginning of the next TOTM.
- The TOTM interval.
- The interval from the end of TOTM to the next OE.
The chart provides a breakdown of returns according to whether the segment begins with the index over or under its lagged 10-day SMA. The chart confirms that the first segment is relatively weak, the second relatively strong and the third flat. It also suggests that position of the index relative to its 10-day SMA at the beginning of the segment discriminates the strength of these effects.
How robust are these relationships?

We test robustness of results in three ways:
First, we repeat the analysis using median returns rather than mean returns. Results are mostly consistent, but median returns are generally higher than mean returns, indicating abnormalities in the return distributions (which can disrupt exploitation).
Second, we repeat the analysis using 5-day, 21-day, 63-day and 200-day lagged SMAs instead of the 10-day lagged SMA. Results are generally consistent, but the discriminating power of the SMA is stronger for shorter measurement periods. The consistency offers some confidence that there is value in the SMA discriminator.
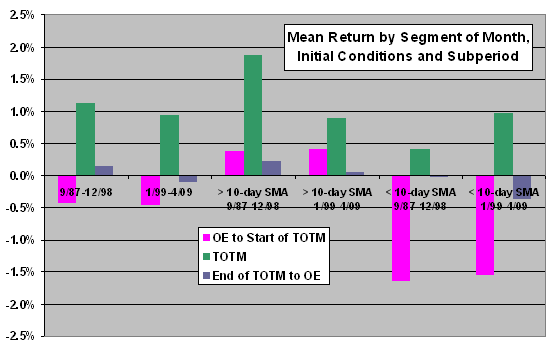
Third, we repeat the analysis for two subperiods: (1) September 1987- December 1998 and (2) January 1999 – April 2009. The following chart summarizes results. These results are fairly consistent across subperiods, offering some confidence that any underlying mechanisms are real and persistent.

In summary, limited evidence suggests that simple trend conditions may amplify return anomalies related to the turn of the month and options expiration. As usual monthly variability is fairly large compared to differences in means for monthly segments.