Does the stock market react reliably and exploitably to the monthly announcements of the change in non-farm employment based on Bureau of Labor Statistics surveys of employers? To check, we examine the typical behavior of stocks during the five trading days before and the five trading days after release dates. Using the unrevised non-farm employment releases and contemporaneous daily S&P 500 index data for the period 2/94-9/07 (164 announcements), we find that…
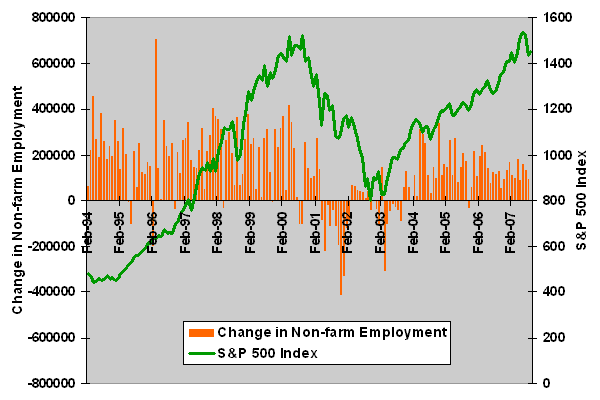
The following chart compares change in seasonally adjusted as-announced (unrevised) non-farm employment with the S&P 500 index on an approximately monthly basis across the sample period. Employment weakens during the 2000-2002 bear market and the beginning of the ensuing bull market, but visual inspection does not reveal any precise relationship.
For greater resolution, we examine short-term changes in the S&P 500 index around employment announcements.
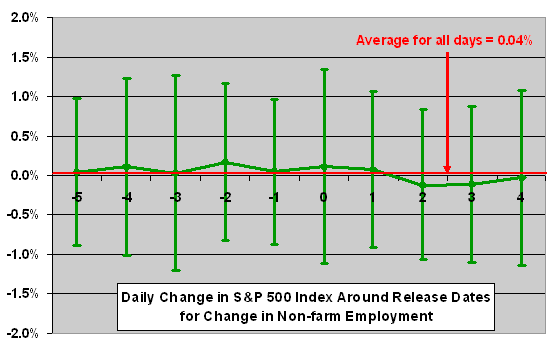
The next chart plots the average return for the S&P 500 index during each of the five trading days before and five trading days after monthly employment releases, with one standard deviation variability ranges above and below the averages, for all announcement dates in the sample. Day 0 is the day of (pre-market) announcement. The average daily return for all days in the sample is 0.04%. The chart shows that, in comparison with standard deviations, all average daily returns around the announcement date are close the average for all days in the sample. There is a hint of abnormal strength the first seven days of the interval and weakness the last three days.
Might different ranges of the change in non-farm employment elicit different responses from investors/traders?
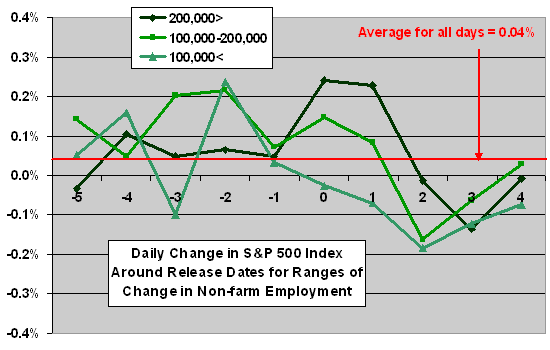
The next chart plots the average return for the S&P 500 index during each of the five trading days before and five trading days after monthly employment releases for three ranges of change in employment: less than 100,000 (100,000<), 100,000 to 200,000 and greater than 200,000 (200,000>). Again, day 0 is the day of (pre-market) announcement, and the average daily return for all days in the sample is 0.04%. Note that the scale on this chart, which does not include variability ranges, differs from that in the previous one.
The chart shows no consistent differences in stock market reactions to the three subsamples during the first five days (pre-announcement) or the last two days , but the immediate post-announcement reactions give signs of liking (disliking) strong (weak) employment growth.
Might the cumulative returns during the first two days after announcement be tradable?
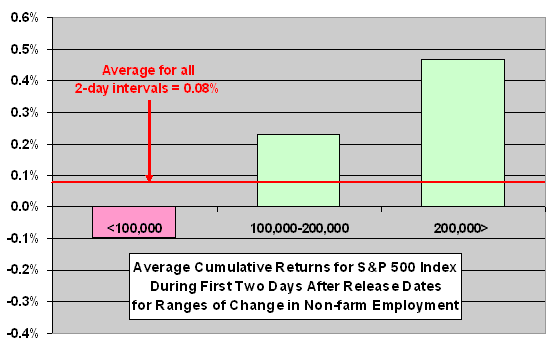
The next chart summarizes the average cumulative return for the S&P 500 index for the day of plus the day after monthly employment releases for the three ranges of change in employment. The average return for all two-day intervals in the sample is 0.08%. The chart suggests a modest opportunity to capture abnormal returns after announcements of large growth in employment.
However, these average returns are still small compared to standard deviations. Are they really tradable?
The following scatter plot relates the cumulative return for the S&P 500 index for the day of plus the day after monthly employment releases to the change in employment. The Pearson correlation for the two series is 0.15, indicating a weak tendency for the stock market and the change in employment to move together. However, the R-squared statistic for the distribution is just 0.02, suggesting that the change in employment explains only 2% of the variation in the stock market during the two-day periods after announcements. In other words, the variability of the relationship makes it practically untradable.
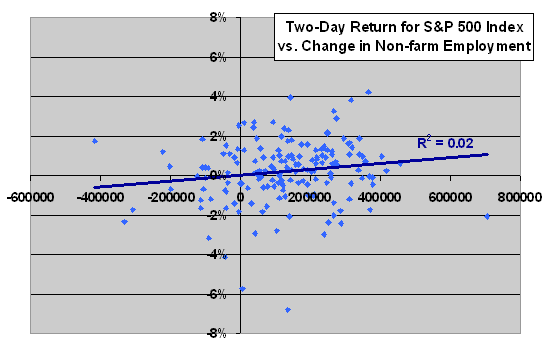
In summary, change in non-farm employment by itself does not offer enough short-term explanatory power with respect to the stock market to justify trading on the announcement.
Note that the above analysis does not take into account revisions to past releases of changes in non-farm employment. These revisions are sometimes up and sometimes down, and they arguably impact investor assessment of the latest data. The analysis also, by using raw change in employment rather than percentage change, ignores the expansion of the overall employment base during the sample period. The media tend to emphasize raw change in employment.