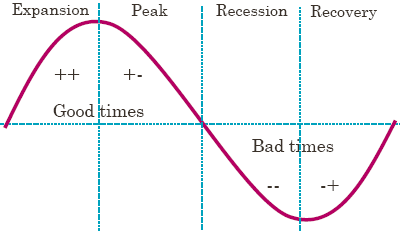
Is there an effective way to enhance allocation of investment funds across asset classes according to economic conditions, from either a risk or a return perspective? In their January 2009 paper entitled “Dynamic Strategic Asset Allocation: Risk and Return Across Economic Regimes”, Pim Van Vliet and David Blitz present constant-risk and return-maximizing asset allocation strategies driven by four economic states: expansion, peak, recession and recovery (see the first chart below). Using data for four U.S. economic indicators (credit spread, earnings yield, Institute for Supply Management manufacturing index and unemployment rate) and returns for eight mostly U.S. asset classes (equities, bonds, cash, small-capitalization stocks, value stocks, growth stocks, credits and commodities) over the period 1948 through 2007 (60 years), they conclude that:
- A combination of the levels of and changes in the four economic indicators defines a four-phase economic cycle that reasonably predicts National Bureau of Economic Research recessions.
- For most assets, returns are higher during recessions and recoveries than during expansions and peaks.
- Variations in asset class returns with the four economic phases indicate that:
- Commodities and large growth stocks are relatively attractive during expansions.
- Government bonds and small value stocks are relatively attractive during peaks.
- Cash and small value stocks are relatively attractive during recessions.
- Credits and commodities are relatively attractive during recoveries.
- Before incremental trading costs, a dynamic asset allocation strategy designed to maintain constant risk across economic phases equal to the overall average risk of a benchmark static allocation outperforms the static allocation by a cumulative 22% over 60 years (0.4% annually, ranging from 0.2% during recessions to 0.5% during expansions). This outperformance is stable from 1948 to 1980, but reverses during 1980 to the mid-1990s.
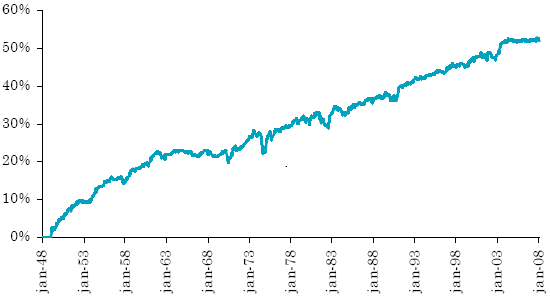
- Before incremental trading costs, a dynamic asset allocation strategy designed to enhance return outperforms the benchmark static allocation by a cumulative 50% over 60 years (0.9% annually). This return-enhancing strategy takes more risk during bad times, when returns are highest, and consequently has a higher overall volatility. (See the second chart below.)
- Outperformance of the dynamic strategies is generally robust to reasonable incremental trading costs.
The following graphic, taken from the paper, depicts the four-phase economic cycle used to switch asset allocations. The average length of each of the four phases is about nine months.

The next chart, also from the paper, shows the cumulative outperformance (50% over 60 years) of the return-maximizing dynamic asset allocation strategy relative to a benchmark static allocation. The static allocation is 40% equities (with 10% in value stocks and 5% in small stocks), 24% in bonds, 7% in commodities and 29% in cash. Equity allocation ranges as high as 51% (during recessions) for the dynamic allocation strategy.

In summary, adjusting asset class allocations according to key economic indicators may help investors manage risk and/or boost long-term returns.
As footnoted in the paper, there may be risks of data snooping bias (via economic indicator selection) and disregard of fat-tailedness (to “limit the impact of outliers and individual factors”) in the analysis.