Do supply chain (trade network) dynamics explain intermediate-term momentum in industry stock returns? In their December 2016 paper entitled “Feedback Loops in Industry Trade Networks and the Term Structure of Momentum Profits”, Ali Sharifkhani and Mikhail Simutin examine whether industry trading network activities create feedback that induces intermediate-term autocorrelation (echo) in associated stock returns. They apply graph theory to quantify supply-demand relationships within industry trade networks and strength of feedback loops that connect each of 49 industries to itself. They then relate network feedback strength to intermediate-term momentum (industry return from 12 months ago to seven months ago) and short-term momentum (industry return from six months ago to two months ago) for each industry as follows:
- Each month, sort the 49 industries into thirds (terciles) by current trade network feedback strength.
- Calculate the value-weighted average return of stocks within each industry.
- Within each feedback strength tercile, form a hedge portfolio that is long (short) the equal-weighted fifth, or quintile, of industries with the highest (lowest) past returns over each of the two specified momentum measurement intervals.
- Calculate average next-month return for each feedback strength-momentum double-sorted hedge portfolio.
Using industry input-output network trade data as issued (partly every five years and partly annual) and monthly industry component stock returns/capitalizations for 49 U.S. industries since 1972, and related analyst coverage data since 1984, all through December 2014, they find that:
- Without accounting for trade network feedback strength:
- The intermediate-term momentum hedge portfolio generates average gross monthly return 0.67% and gross monthly 3-factor (market, size, book-to-market) alpha 0.78%.
- The short-term momentum hedge portfolio generates average gross monthly return 0.08% and gross monthly 3-factor alpha 0.19%.
- Trade network feedback strength relates positively to intermediate-term momentum, but not short-term momentum. Within the third of industries with the highest (lowest) last-month feedback strengths:
- The intermediate-term momentum hedge portfolio generates average gross monthly return 0.97% (0.33%) and gross monthly 3-factor alpha 1.02% (0.43%).
- The short-term momentum hedge portfolio generates average gross monthly return -0.22% (0.12%) and gross monthly 3-factor alpha -0.15% (0.26%).
- Regarding determinants of feedback strength:
- Larger industries (measured by number of firms, average firm size or aggregate market capitalization) tend to have higher feedback strengths.
- Industries with the largest (smallest) average feedback strength over the sample period are: petroleum and coal products; oil and gas extraction; food and beverage and tobacco products; and, farms (social assistance; transit and ground passenger transportation; water transportation; educational services; and, accommodation).
- The relationship between feedback strength and intermediate-term momentum is strongest for industries with poor information diffusion (e.g., low analyst coverage along the feedback loop).
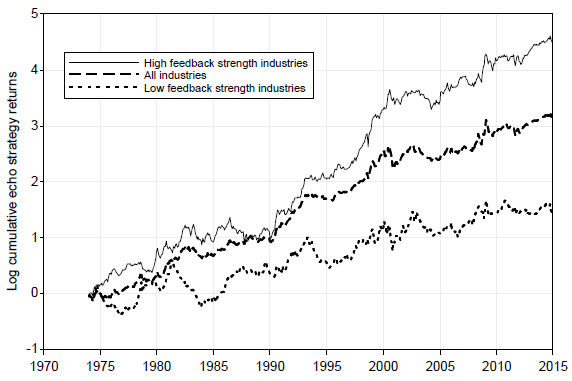
The following chart, taken from the paper, compares logarithms of cumulative gross returns of the intermediate-term momentum strategy applied to:
- The third of industries with the highest last-month feedback strengths.
- All 49 industries.
- The third of industries with the lowest last-month feedback strengths.
The high-feedback strength portfolio outperforms the all-industries benchmark, with much of the outperformance occurring during the late 1990s.

In summary, evidence indicates that the strength of supply chain feedback is a determinant of intermediate-term industry return momentum.
Cautions regarding findings include:
- Results are gross, not net. Accounting for industry stock portfolio turnover and momentum portfolio turnover and shorting costs would reduce returns. Shorting industry portfolios may have been problematic during much of the sample period.
- Double-sorted (feedback strength-momentum) portfolios for a universe of 49 industries have long and short sides of only three industries each.
- The historical trade data:
- May not be published in as timely a manner as assumed, incorporating some look-ahead bias. The publishing cycle for this data (quintennial or annual) mitigates the effect, and the corresponding author reports that findings are generally robust to data lags.
- May incorporate material retroactive revisions made during the sample period, thereby incorporating look-ahead bias. In other words the data are as-revised and not as-released (vintage).
- Trade network feedback strength calculations are beyond the reach of most investors, who would bear fees for delegating them to an advisor/investment manager.
For background, see “Isolating the Decisive Momentum (Echo?)”.