Do specific stocks react differently to economic uncertainty? In their December 2016 paper entitled “Is Economic Uncertainty Priced in the Cross-Section of Stock Returns?”, Turan Bali, Stephen Brown and Yi Tang investigate the role of economic uncertainty in the cross-sectional pricing of individual stocks. They measure economic uncertainty monthly as an aggregation of the volatilities of the unpredictable components of a large number of economic indicators (see the chart below). They then calculate each stock’s sensitivity to economic uncertainty by regressing next-month returns versus economic uncertainty over rolling 60-month windows. Finally, sort stocks into tenths (deciles) by economic uncertainty regression betas and measure economic uncertainty factor returns as the difference in next-month average returns of stocks in extreme deciles. They test robustness via multiple factor models of stock returns and many control variables. Using monthly economic uncertain index data, monthly returns for a broad sample of U.S. stocks and monthly values of control variables during July 1972 through December 2014, they find that:
- Over the sample period, the equal-weighted (value-weighted) decile of stocks with the lowest uncertainty betas outperform the equal-weighted (value-weighted) decile with the highest uncertainty betas by monthly gross average 0.51% (0.40%).
- Across several conventional factor models of stock returns, monthly gross equal-weighted (value-weighted) alphas are about the same as (larger than) the unadjusted extreme decile return premium.
- Stocks with low (high) economic uncertainty betas tend to be small, illiquid, value stocks with low volatility, low market beta and low investment (big, liquid, growth stocks with high volatility, high market beta and high investment).
- The economic uncertainty factor premium is significant:
- After restricting the sample to S&P 500 stocks or to the 1,000 biggest and most liquid stocks.
- After controlling one-by-one and simultaneously for a large set of known stock return predictors.
- For eight of 10 industry stock subsamples (notably not for utilities).
- Economic uncertainty beta predicts cross-sectional variation in stock returns up to 11 months later.
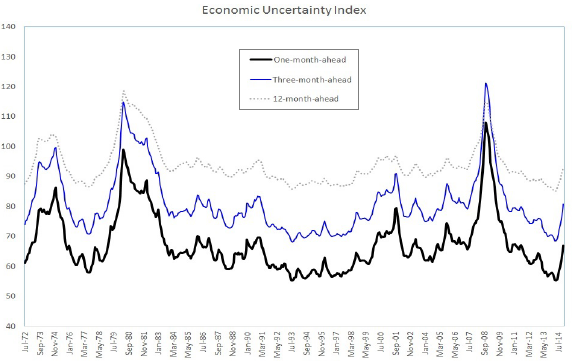
The following chart, taken from the paper, depicts one-month, three-month and 12-month ahead
economic uncertainty indexes (multiplied by 100). These indexes are aggregations of volatilities of the unpredictable components of economic variables encompassing: real output and income; employment and hours; real retail, manufacturing and trade sales; consumer spending; housing starts, inventories and inventory sales ratios; orders and unfilled orders; compensation and labor costs; capacity utilization; price indexes; bond and stock market indexes; and, foreign exchange measures. The three economic uncertainty indexes are highly correlated and are generally high during bad states of the economy.
In summary, evidence indicates that stocks with low sensitivity to economic uncertainty outperform those with high sensitivity on a gross basis.
Cautions regarding findings include:
- Returns and alphas are gross, not net. Accounting for monthly economic uncertainty factor portfolio reformation and shorting costs would reduce premium magnitude.
- Monthly reformation of the long side of the factor portfolio may be costly because it tends to hold small, illiquid stocks.
- Shorting costs may be material because the short side tends to hold volatile stocks.
- Economic data are generally available only with lags and are subject to short-term and long-term revisions. Use of as-revised (rather than as-released) historical data therefore incorporates look-ahead bias.
- Cross-sectional stock return factors based on U.S. data arguably involve aggregate/cumulative snooping bias as addressed in “Taming the Factor Zoo”, thereby overstating statistical significance.
- Data acquisition/processing burdens are substantial and beyond the reach of most investors. Delegating the work to a manager would involve fees.
The economic uncertainty factor explored above may have some connection to the “Bear Market Expectation Risk Factor”.