How does central bank quantitative easing (QE) affect various financial markets? In the May 2013 preliminary and incomplete version of his paper entitled “The Time Horizon of Price Responses to Quantitative Easing”, Harry Mamaysky investigates how U.S. Federal Reserve (Fed), European Central Bank (ECB) and Bank of England (BoE) QE announcements affect the prices of asset classes, including government bills and bonds, currencies, equities, equity volatilities and credit products. He focuses on how long it takes different asset classes to respond to QE announcements (events). He first decomposes the sample period into non-overlapping event windows and non-event windows ranging in duration from two trading days before to 21 trading days after QE events. He then aggregates changes in financial market proxies separately to compare event window and non-event window changes. Using dates for 20 Fed, nine ECB and 11 BoE events and contemporaneous daily values for U.S. and European bill/bond, currency, equity, equity volatility and credit indexes during March 2008 through December 2012, he finds that:
- QE events appear to stimulate substantial repricing of asset classes on two time scales:
- For relatively riskless assets (government bills/bonds and sovereign spreads), repricing most reliably occurs within one or two trading days.
- For relatively riskier assets (equities, equity volatilities and credit products), repricing most reliably occurs over two to four weeks. Over the entire sample period, two-thirds of U.S. and UK stock advances and stock volatility drops occur in windows around QE events. The contrast is sharper in Europe, with stocks rising by one-third around QE events but falling over one-third for the full sample period.
- Results suggest equity market anticipation of QE events begins two trading days before announcements in the U.S. and UK. Lack of anticipation of ECB QE events suggests that these announcements surprise financial markets.
- For example, for the S&P 500 Index during late-2008 through early 2013 (see the chart bel0w):
- The window from two trading days before through 11 trading days after Fed QE events accounts for 42% appreciation out of 61% total.
- The window from two trading days before through 21 trading days after Fed QE events accounts for 55 points of decline in the S&P 500 Implied Volatility Index (VIX) out of a total of 59 points.
- While recovery of asset fundamentals since 2008 may make central bank QE withdrawal less impactful than its introduction, market valuations appear stretched.
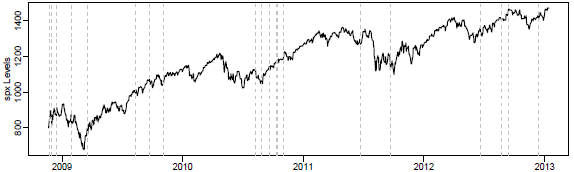
The following chart, taken from the paper, illustrates the timing of the 20 Fed QE announcements considered in the paper with respect to the trajectory of the S&P 500 Index (spx Levels) during late 2008 through early 2013. Visual inspection appears to support a finding that QE events mostly stimulate the stock market for a few weeks.
In summary, evidence suggests that the most reliable impacts of central bank QE actions are nearly immediate for targeted financial assets (bill and bond yields, currencies) but extended (two to four weeks) for other assets (equities, equity volatility and credit products).
Cautions regarding findings include:
- Testing many parameter settings (different event window start and stop points) on same data set introduces data snooping bias, such that the optimal settings are lucky and tend to overstate out-of-sample statistical significance and returns.
- Responses of investable proxies for some of the indexes considered in the paper may differ from those of the indexes (such as VIX futures instead of VIX) due to investor anticipation. For example, see “Exploit Short-term VIX Reversion with VXX?”.
See also “POMO and T-note Yield”, “POMO, TOMO and Stock Returns” and “Federal Reserve Holdings and the U.S. Stock Market”.