Is expected crude oil price volatility (risk) an important economic indicator, thereby influencing stock market and individual stock returns? In their February 2014 paper entitled “Oil Risk Exposure and Expected Stock Returns”, Peter Christoffersen and Nick Pan analyze the impact of expected oil risk on the U.S. stock market and on the cross section of individual U.S. stocks. They measure expected oil risk via option-implied oil volatility based on a 30-day horizon and constructed similarly to S&P 500 Index implied volatility (VIX) . They empirically segment the available sample period into pre-financialization (1990 through 2004) and post-financialization (2005 through 2012) subperiods. Using daily and/or monthly oil options price data, U.S. stock market and individual stock returns and commonly used U.S. equity risk factors during January 1990 through December 2012, they find that:
- After 2005, changes in expected oil risk relate negatively to future stock market returns and positively to future stock market volatility.
- After 2005, a portfolio that is each month long (short) the capitalization-weighted fifth of stocks with the lowest (highest) daily expected oil risk beta over the past month generates an average gross monthly return of 0.66%.
- The average gross monthly four-factor (market, size, book-to-market, momentum) alpha for this portfolio is 0.75%, indicating that expected oil risk is distinct from other commonly used risk factors.
- Precious metals, mining, coal, petroleum and natural gas, steel, fabricated products, textiles and agricultural companies tend to be over-represented among stocks with both low and high expected oil risk betas. In other words, intra-industry and not cross-industry effects drive results.
- During 2005 – 2012, the expected oil risk factor is stronger than market, size, book-to-market and momentum factors and exhibits low monthly correlations with these other factors.
- The above effects are not evident:
- During the 1990-2004 subperiod.
- When sorting stocks on sensitivity to oil returns, oil futures returns or realized oil volatilities from intraday oil futures returns.
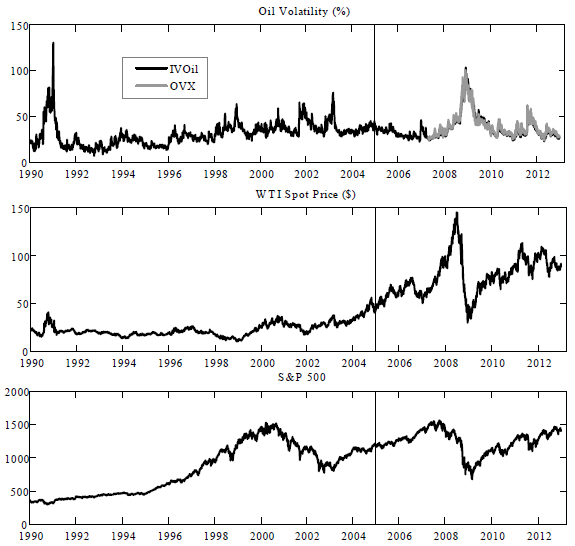
The following set of charts, taken from the paper, plot the daily time series of:
- Upper chart: expected oil risk (IVOil) over the entire sample period (black line) and the CBOE Crude Oil ETF Volatility Index (OVX) since 2007 (gray line). OVX measures the 30-day implied volatility of crude oil prices from United States Oil (USO) options. During the overlapping 2007-2012 subperiod, the correlation between the two series is 0.98.
- Middle chart: West Texas Intermediate (WTI) spot crude oil price over the entire sample period.
- Bottom chart: S&P 500 Index over the entire sample period.
The vertical line through all three charts at the beginning of 2005 separates the sample period into pre-financialization and post-financialization subperiods. Expected oil risk is a significant stock return predictor only in the latter subperiod.
In summary, evidence suggests that investors may be able to exploit changes in OVX as an indicator of future returns for the U.S. stock market and stocks in certain sectors.
Cautions regarding findings include:
- Reported results are gross, not net. Including reasonable trading frictions would reduce performance. Moreover, frictions may vary systematically with sensitivity to expected oil risk, such that net findings may differ from gross findings.
- Results may include data snooping bias related to indicator specification, parameter calculation intervals and subperiod definitions. For example, differences between the 1990-2004 and 2005-2012 subperiods might indicate unreliability in the relationship between crude oil risk and stock returns rather than a confirmation of crude oil financialization as if 2005.
- The available history of OVX is very short.