Can investors reliably exploit monetary expansion and contraction as signaled by decreases and increases in the Federal Funds Rate (FFR)? In the December 2011 version of his paper entitled “Don’t Fight the Fed!”, Paulo Maio investigates the predictive power of FFR for the equity risk premium and the profitability of trading strategies based on this forecasting power. For example, he tests a rule-based strategy that takes a 1.5X leveraged (-0.5X short) position in a broad U.S. stock market index and a -0.5X short (1.5X long) position in the risk-free rate when the change in the FFR is below (above) some negative (positive) threshold, and otherwise a 1.0X position in the stock market index. He also tests a regression-based strategy that takes the above long (short) position in the stock market index if regression of next-month return versus change in FFR forecasts a positive (negative) return. The benchmark for these tests passively holds a 1.5X long position in the stock market index and a -0.5X position in the risk-free rate. He tests similar strategies on other risk factor and asset class indexes. Using FFR changes, one-month Treasury bill yields and monthly returns for a broad U.S. stock market index and several risk-factor portfolios since August 1954, long-term Treasuries and U.S. corporate bond indexes since August 1954, a commodities index since February 1972 and foreign currencies since July 1978, all through 2010, he finds that:
- Change in FFR relates negatively to gross future equity returns at all of 1, 3, 12, 24, 36 and 48 months ahead, with maximum predictive power for the next quarter (R-squared statistic 0.015, indicating that change in FFR explains just 1.5% of next-quarter stock market returns).
- For a broad U.S. stock market index:
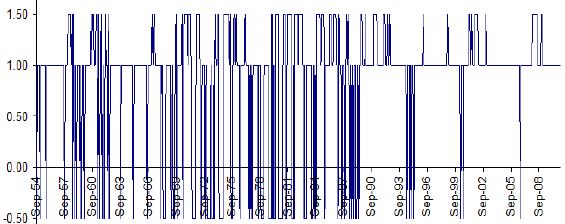
- Over the entire sample period, the rule-based strategy (see the chart below) generates a gross annual Sharpe ratio of 0.55, versus 0.41 for the buy-and-hold benchmark. Outperformance diminishes for a 1983-2010 subsample, with a gross annual Sharpe ratio of 0.47, versus 0.44 for the benchmark.
- The regression-based strategy (with sample period shortened by an initial 10-year “learning” segment) generates a gross annual Sharpe ratio of 0.39, versus 0.32 for the buy-and-hold benchmark.
- For stocks sorted into deciles by size, book-to-market ratio and lagged price momentum risk factors:
- A rule-based strategy that takes a 1.5X (-0.5X) position in the two equally weighted extreme small, high book-to-market or momentum winner deciles and a -0.5X (1.5X) in the two equally weighted extreme large, low book-to-market or momentum loser deciles when the change in the FFR is below (above) some negative (positive) threshold, and otherwise a 1.0X position in the former, generates gross annual Sharpe ratios between 0.47 and 0.58.
- A regression-based strategy that each month allocates 1.5X (-0.5X) to the two equally weighted top (bottom) deciles specified by monthly regressions of next-month decile return versus change in FFR generates gross annual Sharpe ratios between 0.39 and 0.70.
- Similar strategies for other asset class indexes (long-term Treasuries, U.S. corporate bonds, commodities and currencies since July 1978) also enhance Sharpe ratio. A rotation strategy including all asset classes generates a gross annual Sharpe ratio of 0.65.
The following chart, taken from the paper, illustrates stock market index allocation for the rule-based FFR strategy. This strategy takes a 1.5X leveraged (-0.5X short) position in the index when the change in the FFR is below (above) some negative (positive) threshold, and otherwise a 1.0X position in the index.

In summary, evidence indicates that investors may be able to exploit the ability of changes in the Federal Funds Rate to predict gross excess returns across asset classes.
Cautions regarding findings include:
- Asset class and risk factor index returns are gross, not net. Including the frictions involved in constructing tradable assets from selected indexes, and the incremental frictions from changing positions based on FFR signals, would reduce reported Sharpe ratios.
- Analyses essentially assume that the borrowing cost for leverage is the risk-free rate, and that there are no costs for shorting (in fact, shorting accrues the risk-free rate). Including reasonable borrowing and shorting costs may affect conclusions.
- Results may include material data snooping bias derived from the number of strategies, strategy thresholds and portfolio weights considered (whether described in the paper or not).
For other perspectives on the usefulness of FFR for trading, see “Federal Funds Rate and the Stock Market”, “Lead-lag Relationships for Stocks, FFR and Treasuries”, “Federal Funds Rate Size Effect?” and “Reliable Intraday Trades on Federal Funds Rate Decisions?”.