In the absence of solid theory, can an adaptive empirical model successfully infer which economic indicators are driving near-term equity investor/trader behavior? In other words, can a model that continually reselects the current best economic indicators predict stock returns? In her October 2008 paper entitled “Equity Premium Predictions with Adaptive Macro Indices”, Jennie Bai uses time-varying combinations of a large number of economic variables to predict excess (relative to one-month Treasury bills) stock returns. Specifically, she iteratively selects the best macro index of economic indicators according to empirical measurement of the out-of-sample (training interval) power of competing indexes to predict stock returns. Using monthly datasets for 100 economic indicators, one-month Treasury bill (T-bill) yields and returns for a broad value-weighted stock index spanning January 1960 through November 2006, she concludes that:
- An adaptive macro index explains a substantial fraction of short-term future stock returns, offering greater forecasting power than both the historical average of stock returns and commonly used stock market predictors.
- The forecasting power of the adaptive index is cyclic, decreasing before recessions and rebounding during recessions.
- A strategy that switches between a broad value-weighted stock index and T-bills based on the adaptive macro index of economic variables outperforms buying and holding the stock index over the entire sample period and during subperiods, with higher mean return, lower volatility, higher Sharpe ratio and higher terminal wealth (see the chart and table below). Outperformance is large enough to survive reasonable trading frictions.
- Four categories of economic indicators (interest rates, price indexes, housing and employment) are especially relevant for predicting equity returns. In times of prosperity (distress) Investors/traders seem to focus on inflation risk (jobs).
- Results are robust to using or ignoring revisions of initial-release values of economic variables.
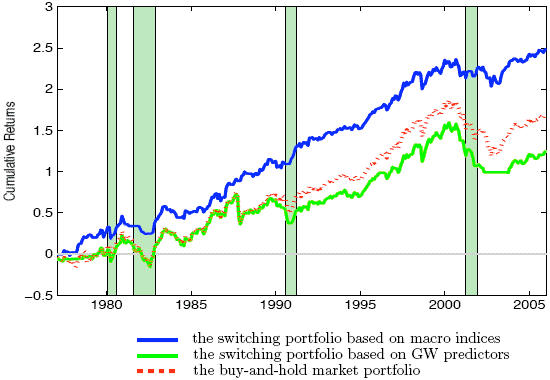
The following chart, taken from the paper, compares the cumulative performance before trading frictions of three investment strategies during 1977-2005, with National Bureau of Economic Research recessions denoted by shading:
- A strategy that switches between a 100% position in a broad value-weighted stock index and a 100% position in T-bills according to whether the current best index of economic indicators forecasts positive excess return for the next month.
- A strategy that switches between a 100% position in the stock index and a 100% position in one-month Treasury bills according to whether the current best index of ten financial indicators (price-dividend ratio, price-earnings ratio, dividend payout, book-to-market ratio, long term government bond return, inflation, net issuing activity, term spread, default spread and default payout) forecasts positive excess return for the next month. These are the ten predictors previously used by Goyal and Welch (GW).
- A strategy that buys and holds the stock index.
The chart shows that an adaptive strategy based on many economic variables (Strategy 1) outperforms both a buy-and-hold strategy (Strategy 3) and an adaptive strategy based on a few commonly used financial indicators (Strategy 2).

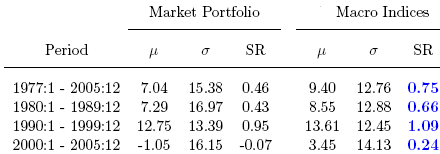
The following table, also from the paper, compares the mean annual return, standard deviation of annual returns and Sharpe ratio for Strategy 1 (“Macro Indices”) and Strategy 3 (“Market Portfolio”) above, before trading frictions. For the overall test period and for all three subperiods, Strategy 1 outperforms on all three performance measures, most markedly during the 2000s. The outperformance of Strategy 1 is consistently large enough to survive reasonable trading frictions.

In summary, investors may be able to boost net returns by timing investments according to an index of leading economic indicators. However, success may depend critically on continually adapting the index to current economic conditions.
While using an out-of-sample training period for current best index selection, the paper does not explicitly address the potential for data snooping bias from iterative consideration of ranges of settings for many parameters.