A reader hypothesized that the Federal Reserve uses Open Market Operations repurchases to stimulate, or prop up, the stock market. The hypothesis supposes that private parties, such as prime brokers, use the funds released by these repurchases to buy (highly leveraged) stock futures contracts, immediately attracting arbitrageurs who simultaneously short futures and purchase stock indexes. Trend followers then pile on. The Federal Reserve states that open market operations regulate “the aggregate level of balances available in the banking system,” thereby keeping the effective Federal Funds Rate close to a target level. The operations are predominantly repurchases, whereby the Federal Reserve provides liquidity. Do these Permanent Open Market Operations (POMO) and Temporary Open Market Operations (TOMO) affect the U.S. stock market? In other words, do the managers of POMO and TOMO transactions act as a “Plunge Protection Team?” Using accepted Treasuries repurchase transaction data for POMO during August 2005 through May 2013 (over 600 transactions) and TOMO during July 2000 through May 2013 (over 2,600 transactions) and contemporaneous daily and monthly closes of the S&P 500 Index, we find that:
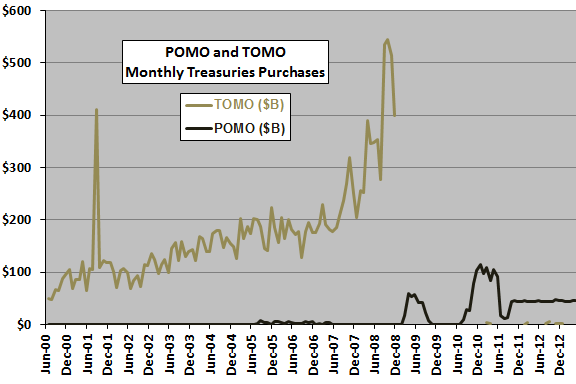
The following chart summarizes POMO and TOMO repurchase activities in billions of dollars aggregated by calendar month over the entire sample period. TOMO are large and growing through the end of 2008, when they essentially cease. POMO pick up in March 2009 and continue to the end of the sample period.
Do monthly stock market returns vary systematically with monthly levels of POMO or TOMO ?
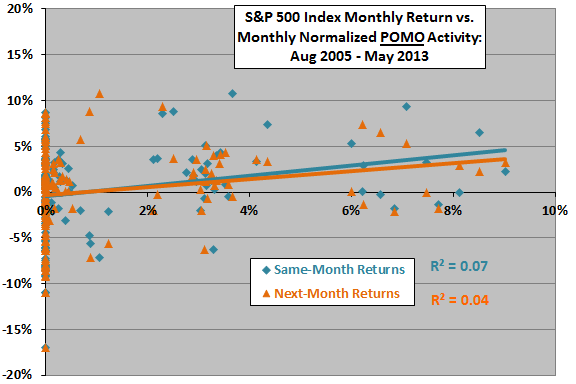
The following scatter plots relate same-month and next-month S&P 500 Index returns to aggregate monthly POMO (upper chart) and TOMO (lower chart) using all available data, including months during which there are no open market operations. For this and all subsequent analyses, we normalize POMO and TOMO each month as the ratio of accepted transactions in billions of dollars to the S&P 500 Index, under the assumption that a given dollar amount of POMO or TOMO should have (under the introductory hypothesis) greater impact when total stock market capitalization is low than when it is high.
The number of months with POMO is only 61. The relationship between same-month (next-month) stock market returns and normalized POMO is positive, with the R-squared statistic indicating that monthly variation in normalized POMO explains 7% (4%) of variation in same-month (next-month) stock market returns. In other words, as hypothesized, the larger the intervention the stronger the stock market. However, given the small sample size and data variability, this conclusion is not firm.
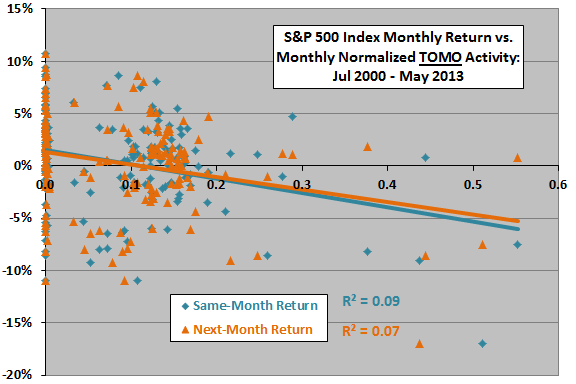
The number of months with TOMO is 117. The relationship between same-month (next-month) stock market returns and normalized TOMO is negative, with the R-squared statistic indicating that monthly variation in normalized TOMO explain 9% (7%) of variation in same-month (next-month) stock market returns. In other words, contrary to the hypothesis, the larger the intervention the weaker the stock market.
Since TOMO are generally much larger than POMO, results for combined operations look much like those for TOMO alone.
Might daily data be informative regarding stock market behavior?
We focus daily analyses on POMO during March 2009 through May 2013.
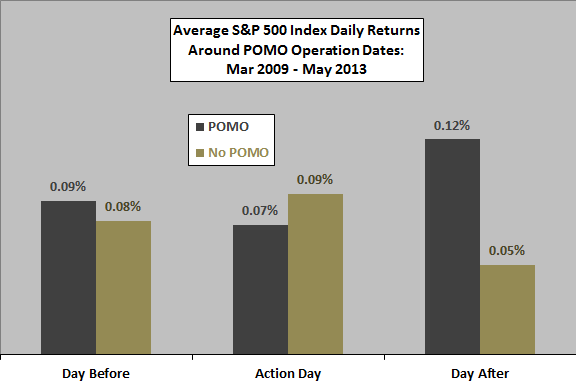
The next chart shows average daily S&P 500 Index returns on the day before, the day of and the day after POMO actions (with settlement generally the next day). The average daily return for all days during the sample period is 0.09%, with most days having POMO action. While there is some indication that the day after POMO action tends to be relatively strong, the magnitude of any effect is small.
Clustering of POMO action days (actions on consecutive or alternating trading days) tends to confound this analysis, inhibiting confidence in conclusions.
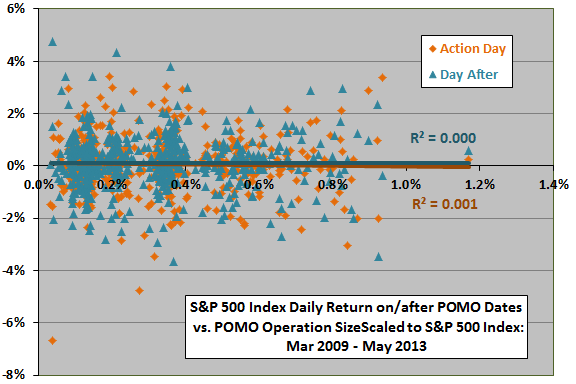
To account for different sizes of POMO daily actions, we use a regression (scatter plot).
The following scatter plot relates daily S&P 500 Index returns (on both POMO action day and the day after) to the daily level of normalized POMO action (scaled to the level of the index) over the sample period. The Pearson correlation for the action day (day after) is -0.02 (0.02) and the R-squared statistic is 0.001 (0.000), indicating that variation in normalized POMO explains nothing about stock market returns.
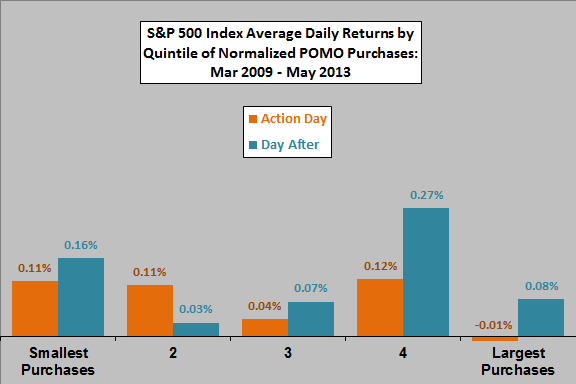
Might there be a meaningful non-linear relationship?
The final chart summarizes average POMO action day and day after date S&P 500 Index returns by ordered fifth (quintile) of normalized POMO purchases over the sample period. Each quintile consists of 108 observations. For both days, lack of progression in average returns with purchase amount undermines belief in a systematic relationship between POMO and daily stock market returns.
In summary, evidence from a variety of analyses of available Federal Reserve open market purchases of Treasuries lends no (some, but inconsistent) support for belief that these operations reliably affect the stock market on a daily (monthly) basis.
The most meaningful result is probably the modest positive relationship between aggregate (monthly) POMO and stock market returns. Cessation of POMO activity may remove a tailwind for stocks.
Cautions regarding findings include:
- As noted, some of the above samples/subsamples are not large in the context of return variability (especially in terms of distinct Federal Reserve initiatives).
- The aggregate effect of the stated Federal Reserve intention to repurchase large amounts of Treasuries over an extended period may have meaningful effects not seen for daily and monthly measurement intervals.
- This analysis does not include Federal Reserve purchases of federal agency housing-related obligations and mortgage-backed securities intended to support the housing market.
See “Federal Reserve Holdings and the U.S. Stock Market” for a look at longer-term, cumulative effects of POMO.