
What is fair value for gold, which has no earnings and pays no dividend? In their 2005 paper entitled “The Price of Gold: A Global Required Yield Theory”, Christophe Faugere and Julian Van Erlach present a model of gold valuation based on a view of gold as a global store of real (inflation-adjusted) wealth. This model generates the price of gold as a function of the global investment yield required to produce a constant real after-tax return equal to long-term real growth in global GDP per capita. Capital flows to (from) gold depend on decreases (increases) in expected returns from other asset classes. Using quarterly data over the period May 1979 through May 2002, they find that:
- Over the sample period, mining operations sustain an approximately constant global stock of gold per capita.
- The RYT model produces a 12% (8%) average absolute tracking error with respect to real gold prices (returns) measured quarterly over the sample period. (See the chart below.)
- By comparison, a mining cost approach to pricing gold produces little volatility and an average absolute quarterly tracking error of 16% over the sample period.
- The real price of gold varies with GDP-weighted world forward earnings yield. Major world events tend to have a large but fleeting impact on gold price.
The following chart, taken from the paper, shows nominal quarterly gold price in U.S. dollars and the corresponding Required Yield Theory (RYT)-modeled value during May 1979 through May 2002. The drivers of change in this calculation are expected global inflation rate, U.S. GDP as a fraction of world GDP and dollar exchange rate versus foreign currencies. The dollar exchange rate accounts for the highest frequency variations, with dollar depreciation (appreciation) driving the fair price of gold in dollars up (down). The mean absolute tracking error is 12%.
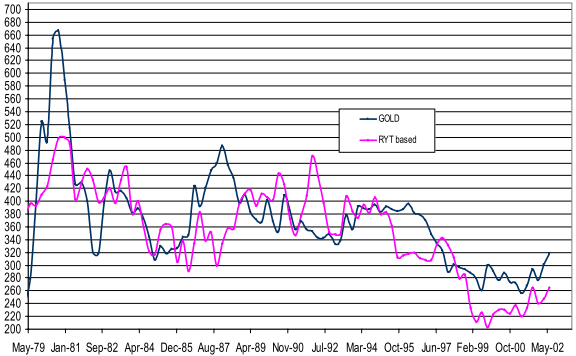
In summary, the Required Yield Theory models the fair value of gold more accurately than a mining cost model, with currency exchange rate and competing asset returns as key drivers of nominal and real gold price variation.
Cautions regarding findings include:
- The sample period is very short in terms of number of inflationary/disinflationary regimes.
- The model is descriptive rather than predictive for the price of gold and gold’s returns. An investor would need forecasts for input variables (such as the expected inflation rate, forward equity earnings yield, currency exchange rates) to use the model to predict gold price and gold returns.
See “Required Yield Theory of Asset Valuation” for application of RYT to the stock market and Treasury instruments.
Frequently Asked Questions
What is Required Yield Theory for valuing gold?
Required Yield Theory (RYT) for gold is a valuation model that treats gold as a global store of real (inflation-adjusted) wealth with no earnings or dividend. It sets gold's price as a function of the global investment yield required to deliver a constant real after-tax return equal to long-term real growth in global GDP per capita. Capital flows to (from) gold when expected returns on other asset classes fall (rise).
Does Required Yield Theory value gold more accurately than a mining cost model?
Required Yield Theory tracked gold more accurately than a mining cost model over May 1979 through May 2002, with a 12% average absolute quarterly tracking error versus 16% for the mining cost approach. It also produced an 8% average absolute tracking error for real gold returns. The result is descriptive, not a test of trading or forecasting performance.
How does the Required Yield Theory model calculate the fair price of gold?
The Required Yield Theory model calculates gold's fair price from the global investment yield needed to produce a constant real after-tax return equal to long-term real global GDP per capita growth. Its main drivers of change are expected global inflation, U.S. GDP as a fraction of world GDP, and the dollar exchange rate versus foreign currencies. The study used quarterly data from May 1979 through May 2002 and assumed mining sustains a roughly constant global gold stock per capita.
How do exchange rates and stock earnings yields affect gold prices compared with mining costs?
In the Required Yield Theory model, the dollar exchange rate and competing asset returns drive gold price variation, whereas a mining cost model produces little price volatility. Dollar depreciation (appreciation) pushes the fair dollar price of gold up (down) and accounts for the highest-frequency variations. The real gold price also varies with the GDP-weighted world forward earnings yield, while major world events have a large but fleeting effect.
What are the limitations of using Required Yield Theory to predict gold prices?
Required Yield Theory is descriptive rather than predictive for gold prices and returns, so it does not by itself forecast gold. An investor would need forecasts of inputs such as expected inflation, forward equity earnings yield, and currency exchange rates. The May 1979 through May 2002 sample is also short in terms of the number of inflationary and disinflationary regimes it covers.