How does the effectiveness of safe havens vary over time? In the February 2012 draft of their paper entitled “Safe Haven Assets and Investor Behaviour under Uncertainty”, Dirk Baur and Thomas McDermott examine the roles of gold and U.S. Treasury instruments as safe haven assets during times of financial markets uncertainty. They define a safe haven asset as an asset that is either uncorrelated or negatively correlated with other assets when those other assets are in distress. They focus on the effects of changes in uncertainty (shocks) on asset values and on the pairwise relationships between stocks, bonds and gold. Using daily returns in U.S. dollars for a global stock market index, U.S. Treasuries (2-year, 10-year and 30-year) and gold bullion (spot and futures) from 1980 through 2010 (more than 8,000 daily returns over 31 years), they find that:
- Over the entire sample period, average daily returns for a stocks, 10-year U.S. Treasury notes and gold are 0.03%, 0.004% and 0.01%, respectively, with standard deviations 0.9%, 0.5% and 1.3%.
- On average over our entire sample period, the correlation of daily returns is:
- Weakly negative for stocks and U.S. Treasuries.
- Positive for stocks and gold, explicable by a strong negative correlation between both stocks and gold and the U.S. dollar.
- Close to zero for gold and bonds.
- Both U.S. Treasuries and gold act as safe haven assets during periods of financial markets stress. However, gains made by gold as stocks drop reverse on average after two trading days. This reversal suggests that investors move rapidly into and out of gold, overreacting to ambiguous market signals and reversing when uncertainty resolves.
- The safe haven behavior of gold (U.S. Treasuries) gets progressively stronger (weaker) as stock returns become extremely negative. Specifically, for “black swan” events such as 9/11 and the collapse of Lehman Brothers, the reaction of gold is faster and stronger than that of U.S. Treasuries. Moreover, the quick reversal of gold returns observed on average does not occur for such extreme situations, perhaps indicative of profound and slow-to-resolve uncertainty.
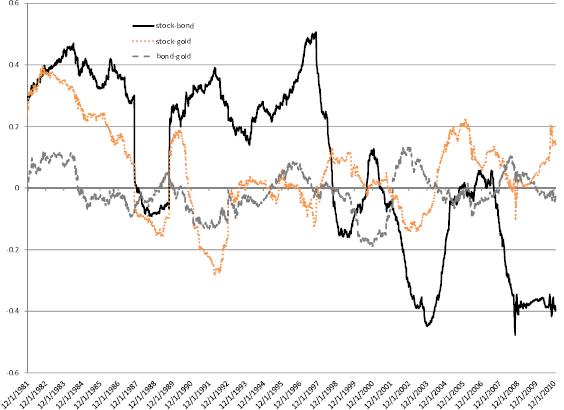
The following chart, taken from the paper, shows the time-varying pairwise correlations for stocks-U.S. Treasuries (bond), stocks-gold and U.S. Treasuries-gold daily returns based on a two-year rolling window. The stocks-U.S. Treasuries correlation swings most wildly between about -0.5 and +0.5, followed by the stocks-gold and the U.S. Treasuries-gold correlations. The stocks-U.S. Treasuries correlation is mostly positive from 1980 through the late 1990s and mostly negative since, with U.S. Treasuries particularly effective at hedging stocks during and after the 2008 financial crisis in 2008.
The variations in correlations confound strategic asset allocation for diversification.

In summary, evidence from daily returns over the past three decades indicate that gold and U.S. Treasuries diversify stocks differently over time and differently during extreme financial markets distress.
The authors speculate that awareness of, and focus on, safe haven assets may cause a “bubble” in their prices that weakens or eliminates their safe haven effectiveness.
Cautions regarding findings include:
- As noted by the authors, there are (by definition) few financial markets crises to study.
- The secular disinflation over much of the sample period may be germane to asset interactions, and this trend may not persist.