As suggested by a reader, this entry examines the stock picking performance of experts featured on CNBC’s Fast Money. According to CNBC, these experts “give you the information normally reserved for the Wall Street trading floor, enabling you to make decisions that can make you money.” Do their stock picks actually make money fast? Do they outperform the broad stock market? Using stock picks recorded in entries entitled “Your First Move for Monday” (or Tuesday when Monday is a holiday) in the Fast Money Rapid Recap archive and weekly price data for those picks over the period 8/10/07 through 2/27/09, we find that:
This sampling method yields 212 picks encompassing 141 distinct stocks and funds. We analyze returns for these picks using the following assumptions:
- Each recommendation executes at the open on the designated Monday (or Tuesday when Monday is a holiday). The return for the first week is therefore from Monday open to Friday close. The returns for holding the position for the next 12 weeks are from Friday close to Friday close. We stop tracking returns after a 13-week horizon because they are not “fast money.” We also stop tracking returns when a pick is acquired and no longer traded.
- When the experts pick a stock more than once, we include its returns multiple times.
- Weekly stock prices are from Yahoo!Finance, except for Hilton Hotels (HLT). Trading in HLT ceased in October 2007. Weekly prices for HLT are from an historical chart at MSN Money, covering only a 10-week holding period from the recommended buy date.
- To adjust for market returns, we subtract contemporaneous weekly returns for SPY.
- Averages weight each stock pick equally.
- Return calculations ignore the impacts of transaction costs/trading frictions, dividends and capital requirements (except for an anomalous $51 dividend paid by MO, which we include).
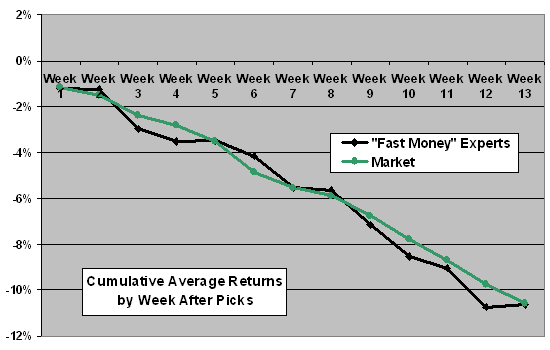
The following chart compares the average cumulative performance of all expert picks in the sample to that of the overall market (SPY) for periods ranging from one week to 13 weeks after pick. Sample size generally declines with length of investment horizon (recent picks have not been held a full 13 weeks), from 212 picks for Week 1 to 174 picks for Week 13. As the sample has grown, the aggregate performance of the experts (before trading frictions) has generally become more like that of SPY. Note that:
The Fast Money experts have on average offered no “fast money.” Average raw cumulative returns for expert picks (black line) are negative for all weeks over the 13-week test horizon (before trading frictions).
The experts as a group perform very similarly to contemporaneous investments in SPY (green line) on a cumulative return basis over nearly all of the 13-week test horizon.
How have the long-only picks of the experts performed?

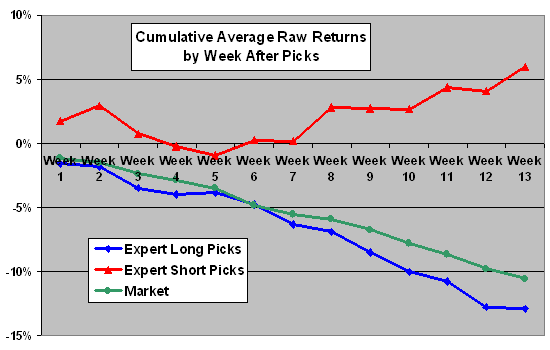
The next chart depicts the average raw cumulative returns for the 188 long and 24 short picks of the Fast Money experts. The short picks include six recommendations to buy inverse funds. The long positions by themselves have underperformed SPY over most of the 13-week test period and indicate no stock picking ability. The short positions alone generate positive cumulative returns for most of the 13 weeks in the test period. Declines in the broad stock market over parts of the test period tend to aid the performance of short positions. However, as seen in the previous graph, the short recommendations do not make the experts outperform the overall stock market.
Can we compare the stock picking abilities of individual Fast Money experts?

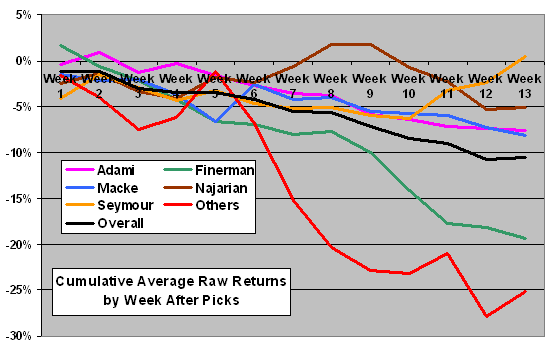
The final chart shows the average raw cumulative returns over a 13-week horizon for five individual Fast Money experts: Guy Adami, Karen Finerman, Jeff Macke, Pete Najarian, Tim Seymour and Others. Results suggest that there could be differences in stock picking abilities. However, subsamples for individuals are small (24-44 for Week 1), and the variabilities of returns across stock picks are very large. Just a couple very good or very bad additional picks could therefore alter relative performance noticeably.
None of the experts have generated attractive raw returns.

In summary, the Fast Money experts as a group probably do not offer fast money with their stock picks, and their stock-picking ability as a group is unimpressive.
Note that SPY is value-weighted, while the expert results are equally-weighted across picks. Some equally-weighted portfolio may be more appropriate than SPY as a benchmark for the performance of the experts.
See Guru Grades for a snapshot of the accuracy of various experts in predicting the direction of the U.S. stock market, including links to evaluations of their individual commentaries. See also Blog Synthesis: The Wisdom of Analysts, Experts and Gurus for more general research on the performance of expert investors.