A reader requested: “Please research The Gleason Report. He seems to have done very well.”
The Gleason Report offers five timing models, two for stocks and one each for bonds, commodities and the dollar. Only one of the two stock market models (the Stock Value Model) and the bond market model have, per information provided, substantial out-of-sample performance data (since 1999).
The Gleason Report web site does not offer enough description of the Stock Value Model via “FAQ: The Gleason Report Stock Model” to evaluate its underlying rules.
Since the level of data snooping bias for backtested results is unknown, we focus on the out-of-sample part of the “Historical Performance of the Stock Market Timing Model” (presumably, the Stock Value Model) as presented. The performance description states: “All trades prior to 1999 are calculated on historical data. From 1999 to year-end 2008, all results are real-time and verified. When out of the market the model is assumed to have earned 5% interest in cash.” We augment the performance data from year-end 2008 through June 2010 with month-by-month signal summaries from archived newsletters, made public with a one-month delay. We do not check whether the performance is actually “real-time and verified.”
Analysis of this out-of-sample data includes the following steps:
- Start the analysis with the model out of the market at the beginning of 1999.
- Use daily closing levels of the S&P 500 Index to identify specific trade dates.
- Replace index levels with same-date adjusted closes for Standard and Poor’s Depository Receipts (SPY) to incorporate dividends.
- Replace returns on cash based on 5% annual yield (unrealistic for the out-of-sample period) with returns based on the average 13-week Treasury bill yield for cash intervals.
- Since there are very few trades, ignore trading frictions.
- End the analysis with the model in the market (marked-to-market) as of the last available newsletter in the public archive (beginning of July 2010).
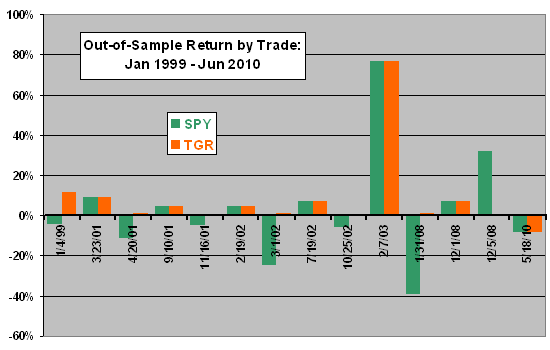
The following chart compares trade-by-trade performance of The Gleason Report’s Stock Value Model (TGR) with that of SPY. With only 13 signals and six round-trip trades, the sample of timing decisions is very small for confident inference. The model does avoid three intervals of substantial stock market decline and participates fairly efficiently in the 2003-2007 bull market. However, its last two signals result in missing the 2009 bull run and participating in market weakness the past few months. Initial investments of $100,000 at the close of the first trading day in 1999 would have terminal values of about $100,000 for SPY buy-and-hold and $256,000 for TGR.

The Gleason Report disclaimer states, in part (underlining added):
“You shouldn’t act on anything without consulting with your investment advisor. Investing involves significant risk and the future performance of the market timing models cannot be guaranteed. The publisher shall have no liability of whatever nature in respect of any claim, damages, loss or expense arising out of or in connection with the reliance by you on the contents of our web site, published material or an alert.”
In summary, while The Gleason Report’s Stock Value Model has performed well in (claimed) real time since 1999, the performance sample is very small for reliable inference in terms of number of signals, and the two most recent signals have poor outcomes.