At the suggestion of a reader, we began tracking on 5/4/06 the intermediate-term stock market outlooks of Steve Todd. Steve Todd is founder of the Todd Market Forecast, which states: “For the years 2003, 2004 and 2005, The Todd Market Forecast was rated #1 for the preceding ten years [by Timer Digest]. For the year 2006, we slipped to #3 and in 2007, we were ranked #5.” His short-term and intermediate-term stock market outlooks are available on a weekly basis at Decision Point. His outlooks are clear and binary, bullish (buy) or bearish (sell). Because Decision Point offers no historical archives, accumulation of recorded switches between these two outlooks is slow. During 5/4/06 through 11/27/12, he has changed his intermediate-term outlook 26 times. Using closing levels of the S&P 500 Index on signal change dates to assess these switches, we find that:
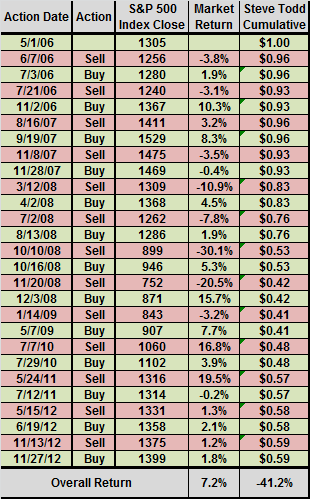
The following table records the points at which Steve Todd identified buying (selling) opportunities based on switches from bearish to bullish (bullish to bearish) intermediate term outlooks since the beginning of May 2006, along with the closing level of the S&P 500 Index on those dates. It also shows the returns he missed (sell-to-buy intervals) or realized (buy-to-sell intervals), with respect to the index, for each switch. Finally, it shows the cumulative value of a $1.00 initial investment traded in and out of the index according to his buy and sell recommendations, assuming return on cash while out of the market offsets trading costs/frictions.
Over the entire test period of 5/4/06-11/27/12, Steve Todd’s outlooks suggest being in the stock market 79% of the time. The cumulative return from trading the S&P 500 Index based on his intermediate-term calls is -41.2%. For comparison, an investor who bought and held the S&P 500 Index over this same period has a cumulative return of +7.2%.
Treating the test initiation date of 5/1/06 as a “buy” date, there are 13.5 buy-sell pairs in the sample. The “sell” levels of the S&P 500 Index are lower than the preceding “buy” levels for eight of 13 observations. The “buy” levels of the S&P 500 Index are higher than the preceding “sell” levels for 11 of 13 observations.

In summary, evidence indicates that a trader using Steve Todd’s intermediate-term stock market calls as made public via Decision Point since 5/4/06 would have underperformed the market substantially.
Reservations regarding this finding include:
- Steve Todd may provide more timely advice to his subscribers than that he offers publicly on a weekly basis via Decision Point.
- The test period may not be representative of Steve Todd’s performance over the very long term.
- The S&P 500 Index used does not include dividends, to the slight disadvantage of “Market Return” in the above overall return comparison.