What is Warren Buffett’s preferred fixed asset allocation, and how does it perform? In his October 2015 paper entitled “Buffett’s Asset Allocation Advice: Take It … With a Twist”, Javier Estrada examines Warren Buffett’s 2013 implied endorsement of a fixed allocation of 90% stocks and 10% short‐term bonds (90/10). Specifically, he tests the performance of eight fixed asset allocations ranging from 100/0 to 30/70. Testing assumes a $1,000 nest egg at retirement, a withdrawal rate of 4% of the initial amount adjusted annually for inflation and a 30‐year retirement. At the beginning of each year, the retiree makes the annual withdrawal and rebalances to the target allocation. The first 30‐year retirement interval is 1900‐1929 and the last 1985‐2014, for a total of 86 rolling intervals. He further explores two adjustments (twists) to the 90/10 allocation:
- T1 – If stocks are up the past year, take the annual withdrawal from stocks and rebalance to 90/10. If stocks are down, take the annual withdrawal from bonds and do not rebalance.
- T2 – If stocks outperform bonds the past year, take the annual withdrawal from stocks and rebalance to 90/10. If stocks underperform, take the annual withdrawal from bonds and do not rebalance.
Using U.S. stock market and U.S. Treasury bill (T-bill) annual real total returns as compiled by Dimson‐Marsh‐Staunton for 1900 through 2014, he finds that:
- Over the entire sample period, the U.S. stock market and T-bills have average annual real compound returns 6.5% and 0.9%, with annual volatility 20.0% and 4.6%.
- In a contest among fixed allocations:
- Only 60/40 has a 0% failure rate.
- 90/10 has low 2.3% failure rate (but not the lowest), high upside potential (but not the highest) and good downside protection (but not the best).
- In other words, 90/10 offers an attractive compromise between best upside potential (100/0) and best downside protection (60/40 and 70/30).
- Results for the two twists on 90/10 are similar (see the table below).
- Both have the same failure rate as 90/10.
- Compared to 90/10, both modestly enhance upside potential (mean, median, 99th, 95th and 90th percentile outcomes) and provide slightly better downside protection (5th and 10th percentile outcomes), with about the same volatility.
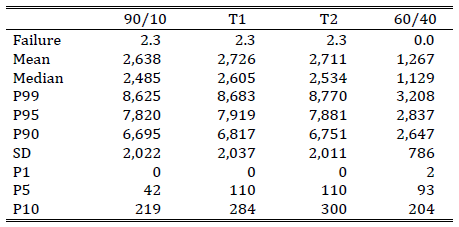
The following table, taken from the paper, summarizes performance statistics based on the test assumptions outlined above for 90/10, T1, T2 and 60/40 allocations over the entire sample period.
- The failure rate (Failure) is the percentage of 86 retirement intervals that run out of money before 30 years.
- The mean and median average terminal wealth in dollars show the typical retiree experience.
- The 99th percentile (P99), P95 and P90 terminal wealth in dollars show lucky retiree outcomes.
- P1, P5 and P10 terminal wealth in dollars show unlucky retiree outcomes.
Results show that 90/10, T1 and T2 are in most ways superior to a conventional 60/40 allocation.
In summary, available evidence indicates that Warren Buffett’s implied endorsement of a fixed 90/10 stocks/bonds allocation in retirement is sensible, and that simple adjustments to this strategy modestly improve retirement outcome.
Cautions regarding findings include:
- Performance data are gross, not net. Construction of a liquid tracking fund for the U.S. stock market and annual rebalancing frictions would lower performance (much less so in recent decades than before).
- The number of independent 30-year retirement intervals in the sample is small (less than four), so findings may not be representative of all retirements.
- Testing different strategies on the same data introduces snooping bias (luck), such that the best-performing strategy overstates expectations.